
ICT 2016 Unit 040: Open Float and Quarterly Highs/Lows
Review open float as unfinished liquidity around quarterly highs and lows, then distinguish a sweep from sustained structural acceptance.
Open float is a way to discuss potential orders that have not yet been processed around visible highs, lows and range boundaries. It is a review lens, not a volume measure and not a prediction that price must clear one side next.
Map the two sides first
Above a prior high may be protective buy stops and breakout participation. Below a prior low may be protective sell stops and breakdown participation. Mark both sides before deciding which explanation fits the later move.
Planned diagram position: after ## Map the two sides first and before ## Quarterly highs and lows as references.
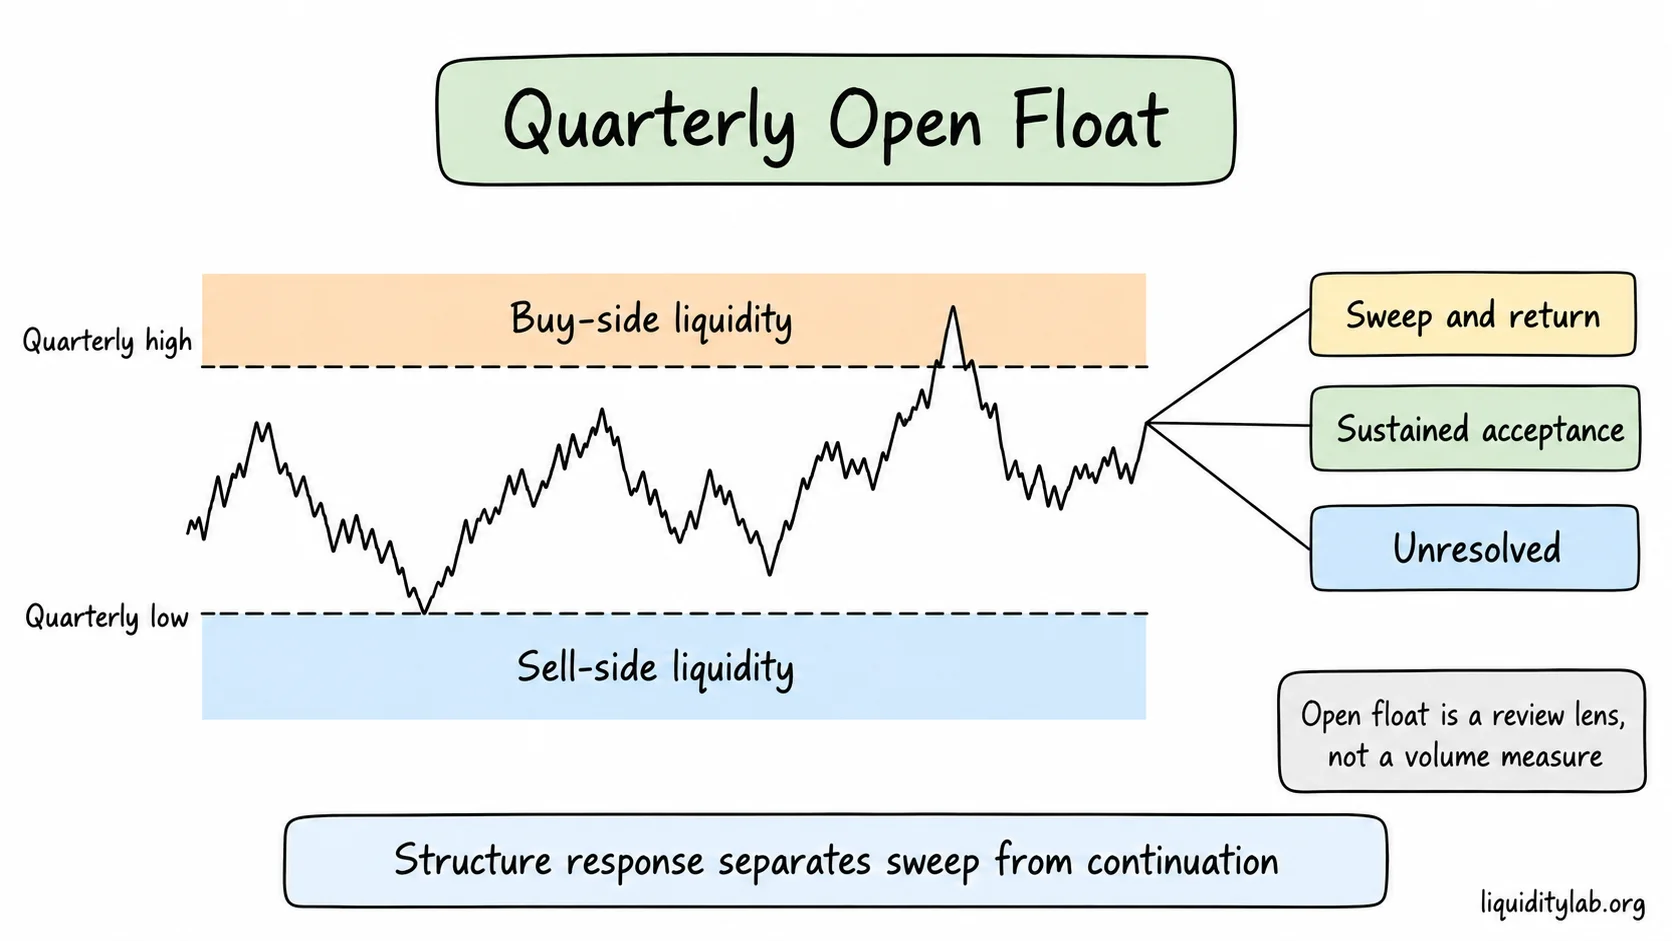
Open Float organizes unfinished liquidity; structure response supplies the evidence.
Quarterly highs and lows as references
Three-month highs and lows can remain visible to many participants, which makes them useful review anchors. Six- and twelve-month references may matter in a broader study, but adding more levels does not automatically improve the explanation.
Sweep or sustained acceptance?
A break beyond a high or low is only an excursion until the response is recorded. Compare the body closes, displacement, retest, nearby liquidity and follow-through. A quick return and continued acceptance describe different states.
Why the range middle is different
The middle of a range often contains competing explanations and less obvious external liquidity. When price oscillates there, record the balance and wait for a boundary response instead of treating every short move as a directional signal.
Build a daily bias as a hypothesis
Use the larger high and low, the recent structure and the latest response to state a conditional bias. Write what would support it and what would weaken it. The bias should remain revisable when the market accepts beyond the reference.
Review workflow
- Mark the quarterly high, quarterly low and the current range.
- Map possible buy-side and sell-side liquidity on both sides.
- Record the first excursion and the later body acceptance.
- Compare the move with the daily and higher-timeframe structure.
- State a conditional bias with an invalidation observation.
- Keep the range-middle cases as counterexamples.
A reservoir of unfinished orders
Open Float is like a reservoir whose water level is not directly visible. Highs, lows and range boundaries are clues about where pressure may be stored, while the later response shows whether the explanation held.
Misconceptions: Open Float is not a volume indicator; a quarterly high is not a guaranteed destination; a break is not continuation until acceptance persists.
Review exercise
Choose three completed quarterly ranges. For each, hide the later candles, map both sides, write a sweep explanation and a continuation explanation, then reveal the response. Include one range where the first break failed and one where acceptance continued.
Short review
1. Price breaks a quarterly high and returns. Sample reasoning: record a sweep-and-return candidate and check the next structure before assigning direction.
2. Price accepts above it. Sample reasoning: weaken the quick-sweep explanation and update the daily bias hypothesis.
Learning boundary
Open float does not provide automatic entries, stops, targets, probabilities or guaranteed trend starts. Continue with Unit 041: IPDA Data Ranges to organize 20-, 40- and 60-day reference windows.
Review questions
- Which highs and lows define the review range?
- What evidence separates a sweep from sustained acceptance?
- What did the range middle leave unresolved?
- Which later observation would weaken the daily bias?