
ICT 2016 Unit 001: Four Market States
Learn the four ICT market states and how order blocks, fair value gaps, equilibrium and liquidity references fit into a price sequence.
When price moves quickly, it is tempting to explain it immediately: a trend has started, institutions are accumulating, or a reversal is underway. The first task is simpler. Describe the movement well enough that someone else could recognize it without hearing your explanation.
This lesson introduces consolidation, expansion, retracement and reversal, then places order blocks and fair value gaps inside that broader picture. You should finish able to describe a sequence, explain why a label is provisional, and recognize more than one possible pullback path.
Prerequisite: recognize candles, swing highs and lows, and a trading range. Review Market Structure Basics if needed. All scenarios below are invented illustrations. For your own historical review, record the instrument, date, timeframe and data source before calling an example a documented case.
A walking group, not a timetable
Imagine a walking group meeting in a square. People gather within a small area, move down a street, slow down to regroup, and sometimes change direction. The analogy helps distinguish gathering, progress, adjustment and a change of route.
A chart differs in an important way: there is no shared itinerary visible to us. Price can resume, stall or change direction. The four states are a vocabulary for describing those changes, not four compulsory stops in a cycle.
The four states
Consolidation: repeated movement within a range
In consolidation, price repeatedly moves through an overlapping area. Highs and lows offer working boundaries, while repeated returns and overlapping candles suggest that movement beyond those boundaries has not persisted.
Start by recording which timeframe you are using, where the range begins, and which observations support its boundaries. A short pause inside a larger advance can be a consolidation on a small timeframe without defining the larger market's state.
Calling a range “accumulation” adds an explanation about positioning. The chart may support the observation that exchange continues within the range; it does not identify who is building a position. Nor does a lengthy range establish the direction or size of the next move.
Expansion: movement away from the previous range
Expansion describes a relatively decisive departure from a reference area. There may be larger candle bodies, less overlap and successive movement in one direction. What counts as large or fast depends on the surrounding chart.
One long candle is an event, not proof of a lasting trend. Ask where the movement started and what followed. Did subsequent candles remain outside the previous range? Did progress continue, or did price immediately return?
For an illustrative example, imagine an instrument moving above an earlier session's high and then continuing to trade above the old range. That sequence helps explain expansion. Naming the instrument or session would not make the outcome more reliable.
Retracement: movement back through part of an earlier advance or decline
A retracement is a move against a preceding directional leg. It may overlap more, move more slowly, or revisit earlier reference areas. None of those features is required in every instance.
Think of the walking group slowing and stepping back to collect someone. A temporary return need not change the route. However, you cannot insist on the “temporary” label after the wider pattern changes. Record which swing or range you are comparing with the return and what evidence would make the retracement interpretation less convincing.
An illustrative sequence might expand upward, return into part of that expansion, then resume upward. Another might return just as neatly and subsequently continue lower. The early appearance alone cannot distinguish their final outcomes.
Reversal: the earlier directional structure changes
A reversal describes a more substantial change than a single opposing candle. Compare the earlier sequence of swings with the later one. Does price cease making progress in its previous direction? Does the subsequent structure support movement the other way?
A brief excursion above a prior high followed by a return is observable. Describing it as a completed reversal requires further context; describing it as deliberate stop hunting requires evidence about intent that the price pattern does not supply.
The word is also relative to scale. A reversal of a short upward leg may remain a retracement within a larger decline. Always attach a timeframe and reference leg to the label.
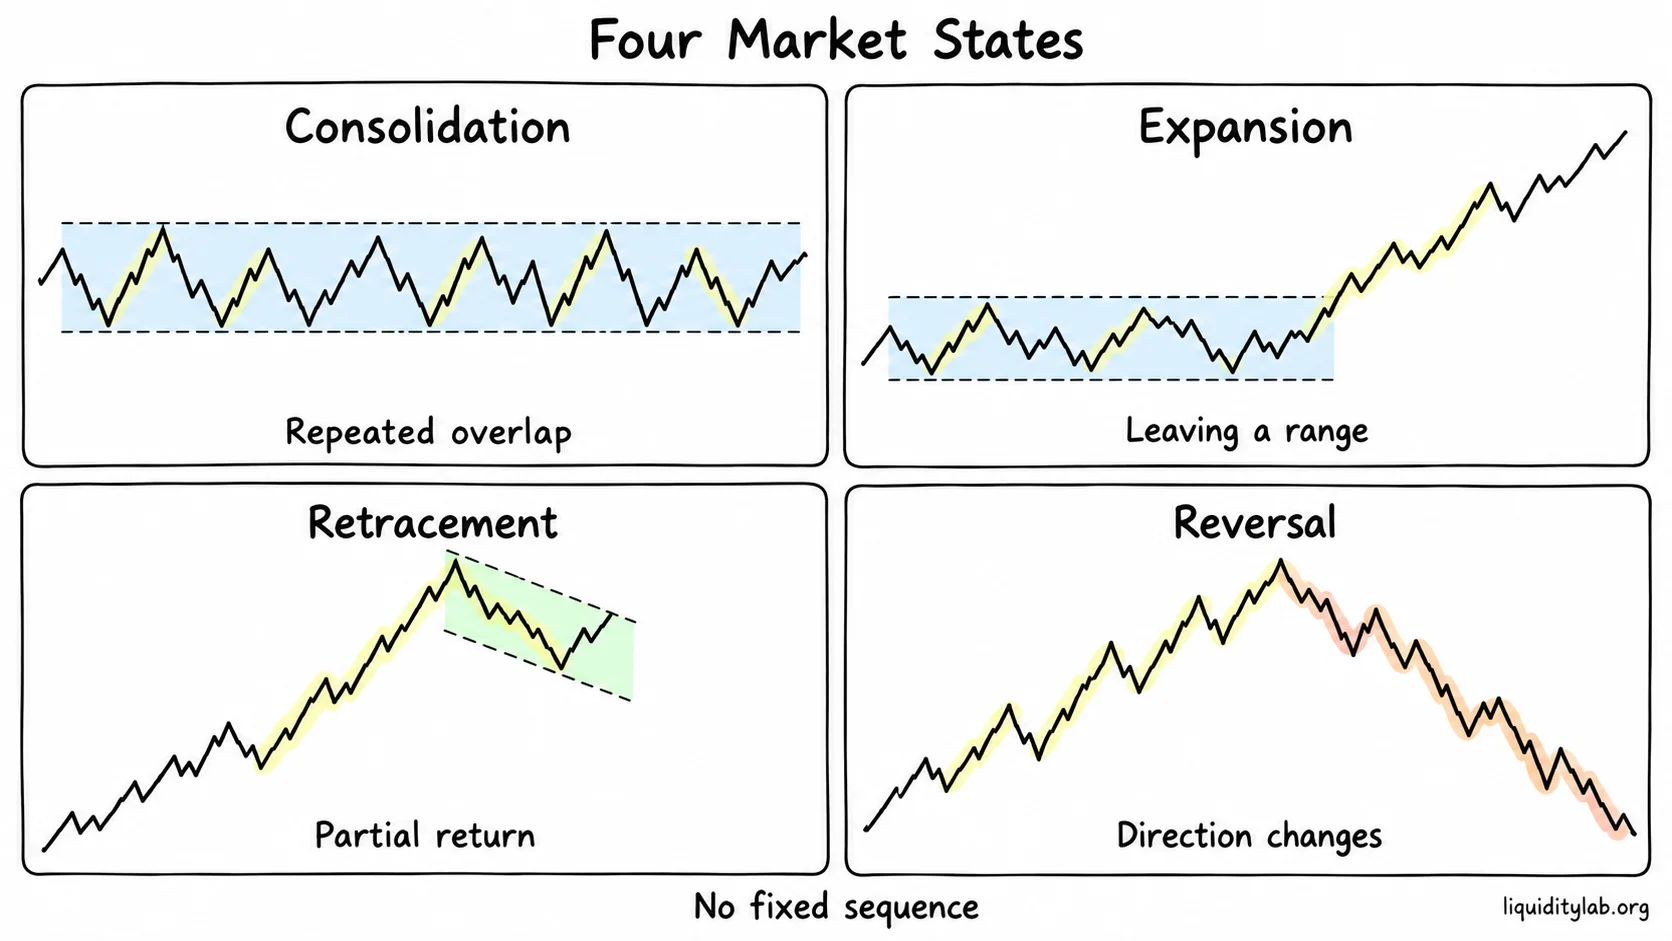
Four ways to describe price movement; the reference leg and timeframe determine the label.
Read a sequence without forcing a cycle
Consider this invented sequence: overlapping movement inside a range, a departure above it, a partial return, renewed upward progress, and finally a sustained decline into a new range. It offers examples of all four states, but the labels become clearer as more observations arrive.
Now change one detail: the first departure immediately returns and the range continues. There is no need to invent a missing retracement or reversal to complete the model. Describe a failed departure and continuing consolidation.
“Acceptance” in these notes is shorthand for subsequent price action continuing to trade in an area. “Rejection” describes a departure that does not persist and a return away from the tested area. Neither word means we have measured every participant's agreement, and neither comes with a universal candle count.
Put the tools back inside the movement
Order blocks and fair value gaps are often drawn as similar rectangles. They describe different parts of a sequence.
| Reference | What it describes in this framework | What to record |
|---|---|---|
| Order block (OB) | A selected opposing candle or region before a meaningful displacement | The departure it belongs to and what happens if price revisits it |
| Fair value gap (FVG) | A three-candle range non-overlap associated with displacement | Its formation, whether it is revisited, and whether price moves through it |
| Equilibrium (EQ) | The midpoint of a deliberately selected high-to-low range | The endpoints used; a midpoint changes when the reference range changes |
| Liquidity pool | A hypothesized concentration of orders near a visible reference such as prior highs or lows | The level, why it is noticeable, and price behavior around it |
For a common upward FVG definition, the first candle's high is below the third candle's low, with the displacement candle between them. The downward version mirrors that relationship. This is a relationship between candle ranges, not proof that no transactions occurred at those prices: the middle candle moved through the area. The course's “inefficient delivery” language is an interpretation of the pattern.
An OB similarly does not let us see a store of unfilled institutional orders. It is a chosen reference attached to a particular move. Without identifying that move, coloring a candle or region adds little explanatory value.
A supply room and a skipped shelf
Picture a worker leaving a supply room and moving quickly along an aisle. The supply room represents the departure area; an incompletely checked shelf represents something left along the route. A short return might reach only the shelf. A longer return might extend to the supply room.
That is the useful part of the OB/FVG analogy: the references may occupy different positions along the same movement. The analogy does not mean price needs to collect missing supplies or must revisit either location.
In a simplified upward expansion with an FVG above an OB, compare four possible observations:
- Price returns only into the FVG region before moving upward again.
- Price passes through that region and reaches the earlier OB area.
- Price passes through both, weakening the earlier continuation interpretation.
- Price never revisits either region during the observation window.
All four belong in a review. “No return” is a result, not a missing example. If OB and FVG references overlap, their shared origin may be the same displacement; two labels do not create two independent pieces of evidence.
Misconceptions to catch
“Every expansion starts a trend.” A rapid departure may fail. Inspect its relationship to the previous range and subsequent movement.
“A filled FVG means price must resume.” A revisit records where price went. It does not establish what happens next.
“EQ is the asset's fair value.” Here it is arithmetic applied to a chosen range, not a valuation of the asset.
“The four states reveal a market maker's plan.” They organize visible behavior. A plan would require different evidence.
Short review
1. A large upward candle exits a range, and the next candles return inside. How would you describe it?
Sample reasoning: I observed an upward departure that did not persist. I would check whether the original range still organizes the subsequent movement rather than declare a new trend from the first candle.
2. Price passes through an FVG and then an OB. What should change in your notes?
Sample reasoning: I would record both passages and revise any interpretation that depended on a reaction at those areas. I would not move the boxes after the fact to make the example appear successful.
3. A small chart appears to reverse while the daily chart remains inside its previous upward leg. Is one chart wrong?
Sample reasoning: Not necessarily. They describe different reference movements. I would write “short-term reversal within a larger retracement” only if the marked swings support both descriptions.
Continue learning
Next: Unit 002 — Market Makers, Liquidity and Evidence.
Optional definitions: Market Structure Basics, Liquidity Pool, Order Block — Pro, and Fair Value Gap — Pro. The explanations needed for this lesson are included above.
Return to the ICT 2016 Study Notes. The scenarios are educational illustrations, not verified historical cases or instructions to trade.