
ICT 2016 Unit 007: Liquidity and Path Resistance
Study liquidity as transaction speed and price impact, then compare dense and open price paths without treating them as outcome guarantees.
Liquidity is easiest to study as a market condition: how quickly can an asset change hands, and how much does price move while it does so? It is a description of participation and price impact, not a direction signal.
A simple comparison
A popular concert ticket may find a buyer quickly. An old piano may require a large price concession before anyone accepts it. The first situation has more visible demand and lower immediate price impact; the second has fewer ready counterparties.
In a chart, the evidence is indirect. We can observe speed, overlap, gaps, repeated highs and lows, and the response after a level is crossed. We cannot see every resting order or identify a participant's private intention from candles alone.
Where liquidity may cluster
Previous highs and lows are useful references because many participants may react around visible boundaries. A high above a prior swing can be studied as a possible buy-side liquidity area; a low below a prior swing can be studied as a possible sell-side area. These are hypotheses about where attention or orders may collect.
| Record | Safer wording |
|---|---|
| Price crosses a prior high | The reference was exceeded and later response can be reviewed. |
| Price returns below it | The excursion did not persist over the selected window. |
| Price continues above it | The old boundary became a less useful description of the current state. |
| Participant motive | Unknown unless supported by evidence beyond the chart. |
Calling every excursion a “liquidity hunt” adds a story without adding a test. Keep the observable path beside the framework label.
High-resistance and low-resistance paths
A high-resistance path contains many visible swings, overlapping ranges or nearby boundaries. Price may need to cross several areas where earlier participants could respond. A low-resistance path contains fewer obvious opposing references over the selected window.
This is a path description. Low resistance does not mean easier profit, and high resistance does not mean that price cannot travel. News, new information and a larger timeframe can change the map quickly.
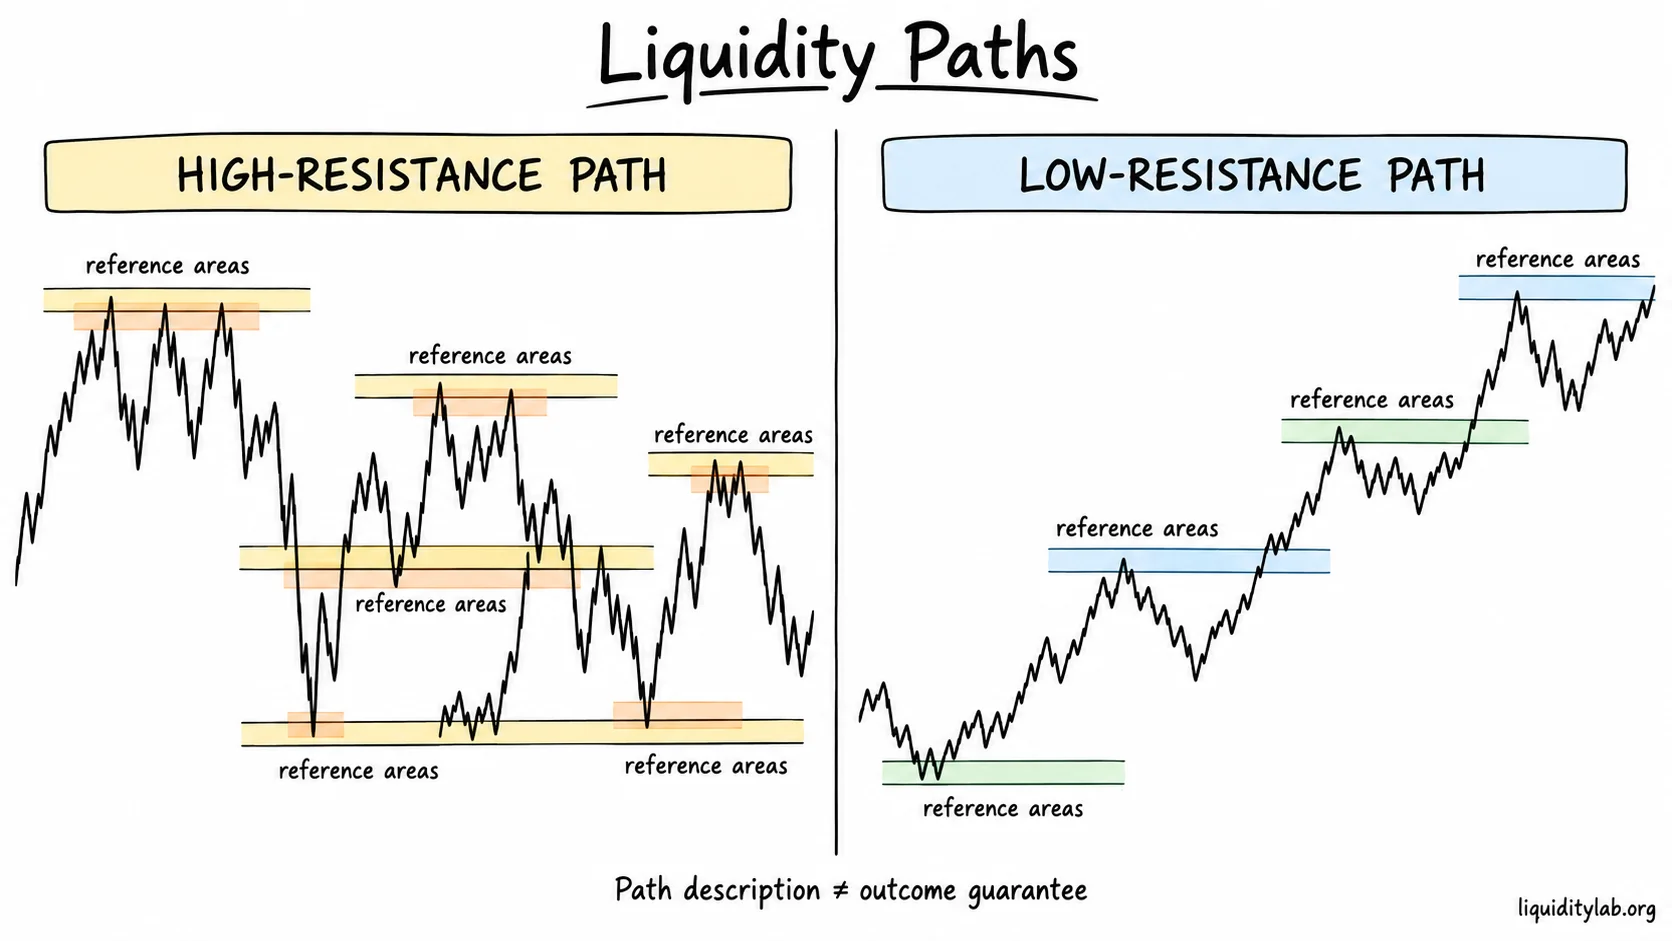
Path resistance describes visible structure; it does not guarantee the outcome.
Events can redraw the map
Rate decisions, employment data or unexpected events can move price through a boundary that had previously held. Separate the pre-event and post-event records. A pattern that seemed stable in ordinary conditions may not describe a shock window.
Review exercise
Choose a completed range. Mark the prior high, prior low and the visible obstacles between them. Record whether price extended, returned or consolidated after touching each boundary. Add the timeframe, data source and any major event. Then ask:
- Which statements are chart facts?
- Which are framework interpretations?
- What would make the path map less useful?
Continue with Unit 008: Price Swings and Contraction. Liquidity, resistance and participant labels are educational observation language; they do not provide entries, stops, targets, probabilities or return promises.