
ICT 2016 Unit 030: Rejection Blocks
Review rejection blocks through failed breaks, candle bodies, liquidity context and later evidence instead of relying on wicks alone.
A rejection block describes a failed attempt to hold beyond a visible area. The wick may show the excursion, but the body, surrounding liquidity and later response determine how much the event can explain.
The failed break comes first
Start with the level that price attempted to cross and the orders that may have concentrated around it. A rejection hypothesis needs an excursion and a return, not just a long wick. Keep bullish and bearish cases symmetric in the review.
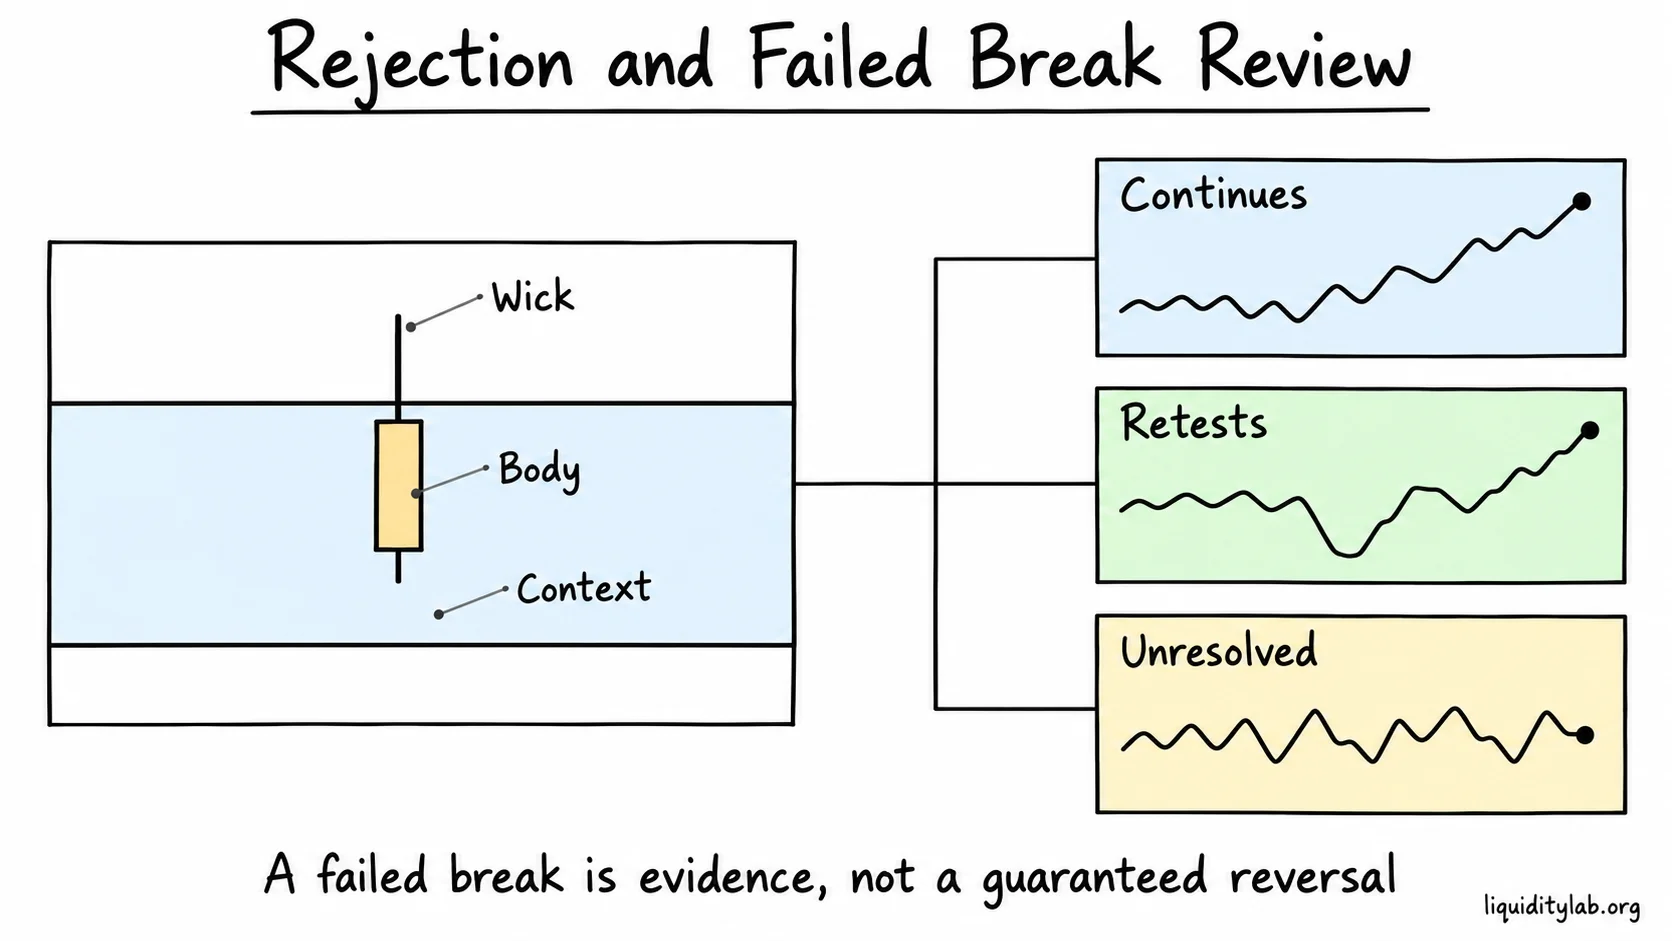
Rejection is assessed from the body, context and later response.
Body, wick and context
The candle body shows where the period accepted price; the wick shows where price travelled and was not retained. Neither is sufficient alone. Compare the event with the higher-timeframe range, nearby liquidity and the next sequence.
Three possible outcomes
After a failed break, price may continue away, retest the area, or return into the range without resolving the question. Record the response window before assigning a stronger label. A rejection is evidence of failed acceptance, not a guaranteed reversal.
Review exercise
Mark one upper-side and one lower-side failed break from completed charts. For each, record the level, excursion, body close, nearby liquidity and next response. Add one case where the apparent rejection failed to produce a durable move.
Learning boundary
Rejection blocks do not provide automatic entries, stops, targets, probabilities or proof of hidden intent. Use them to organize chart evidence, then compare the result with the broader ICT / SMC Learning Path.
Review questions
- What level was tested, and what was the excursion?
- What did the candle body retain or reject?
- How did nearby liquidity and higher-timeframe context affect the reading?
- Did the later response continue, retest or remain unresolved?