
ICT 2016 Unit 002: Market Makers, Liquidity and Evidence
Understand market makers, liquidity pools, boundary tests and session context while separating chart evidence from claims about institutional intent.
In Unit 001, we described movement before explaining it. Now we examine the explanation most likely to take over an ICT discussion: “the market maker moved price to liquidity.”
That sentence combines a participant, an observed move and an alleged purpose. Those are different claims. This lesson shows how to keep the useful liquidity questions while testing how much the chart actually establishes.
A market maker is a role, not an all-seeing character
In ordinary market terminology, a market maker provides quotations and stands ready to transact under the arrangements of a particular market. Providing liquidity also involves managing inventory and exposure. The precise role depends on the venue and instrument; it is not the same as being an exchange that matches everyone else's orders.
A used-book dealer offers a useful analogy. The dealer has buying and selling prices, carries inventory, and adjusts quotations as stock and customer demand change. That helps explain why a liquidity provider's circumstances matter. It does not mean one dealer controls the entire city's book prices.
ICT's “market maker” language sometimes goes further, presenting price movement as organized delivery between liquidity references. We use that as a framework interpretation. It should not silently turn the real quoting role into a claim that a single participant directs every candle.
Likewise, “smart money” groups together participants with different resources, information and execution capabilities. It is not a visible category on a candle, a moral ranking, or evidence that all large participants want the same outcome. Larger size can also make completing an order more complicated.
What a liquidity pool means here
Visible highs, lows and range boundaries are places where traders may make related decisions. The framework therefore treats them as potential concentrations of orders. Above prior highs, it uses buy-side liquidity; below prior lows, sell-side liquidity.
These labels refer to the possible direction of orders that could become active, not a recommended direction for the reader. A buy order, for example, could open a position or close an existing one. A simple candle chart does not reveal the full mix, quantity or owners of such orders.
Mark a prior high because you can identify it on the chart. Then write the liquidity claim separately: “Orders may be concentrated around this visible reference.” Without appropriate order data, the concentration remains a hypothesis rather than a measured inventory.
The next observation matters. Price may move beyond the reference and remain there, briefly exceed it and return, or never reach it in the chosen window. A liquidity reference does not select among those outcomes by itself.
One pattern, three levels of claim
Here is an illustrative scenario, not a documented historical event. Price oscillates inside a range, briefly moves above the upper boundary, returns inside, and later extends below the lower boundary.
| Level | A careful record | What would overreach |
|---|---|---|
| Observation | Price exceeded the marked high, returned to the range, then moved below its low. | A bank deliberately forced traders out. |
| Framework interpretation | ICT might describe the excursion as a liquidity sweep followed by expansion. | Every excursion must produce the same sequence. |
| Unknown | The chart does not identify the active orders, their owners or their motives. | The later decline proves the earlier intention. |
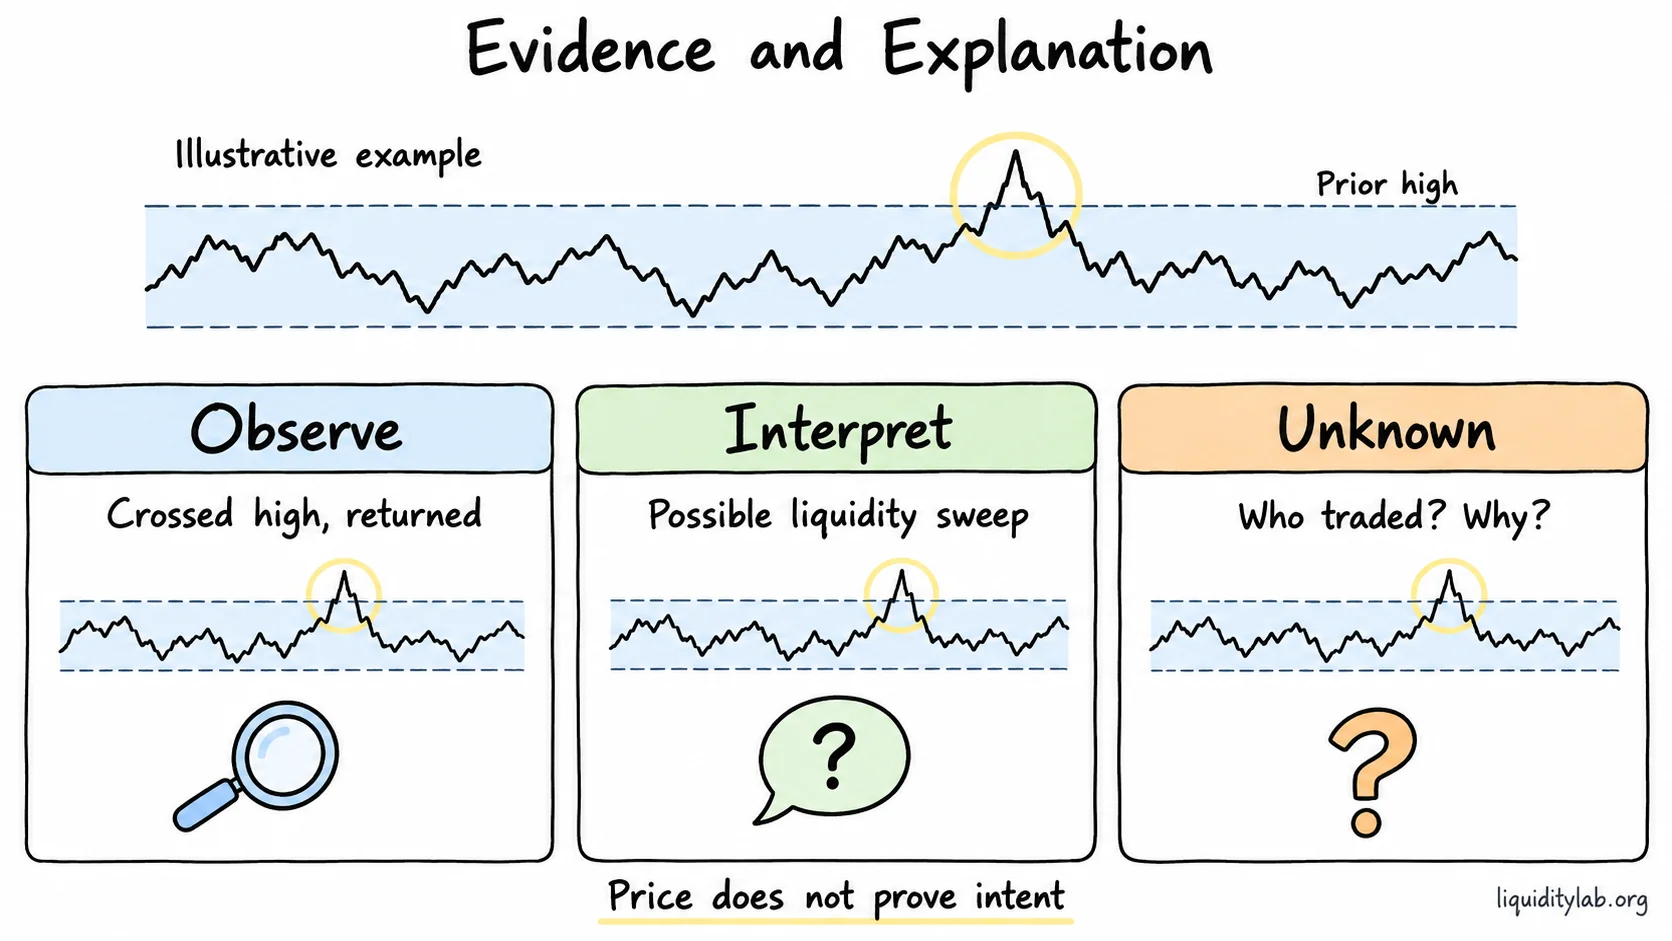
A chart can show an excursion and return without revealing who caused it or why.
A liquidity sweep is useful vocabulary for a particular relationship between a level and subsequent price action. It is not a direct observation of manipulation. Other possible explanations for the same price path include changing available liquidity or new orders and information; a candle sequence alone cannot settle the cause.
Now consider the counterexample: price moves above the same boundary, spends time outside, and continues upward. Record the persistence rather than insist that an expected sweep must still be coming. This second sequence is essential to understanding the first.
Accumulation, probing and expansion
The source notes introduce three narrative phases. Their value becomes clearer when translated back into observable language:
- Accumulation: overlapping movement within a relatively narrow range. The range is visible; net accumulation by a particular participant is not established.
- Manipulation or probing: an excursion beyond a reference, sometimes followed by a return. “Probing” describes the event with less assumed intent. “Manipulation” is a course label, not a finding about conduct.
- Distribution or expansion: movement away from the range. Expansion describes movement; distribution can imply a transfer of holdings that price alone cannot confirm.
These overlap with Unit 001's four states. They are alternative descriptions of some of the same evidence, not independent confirmations. A range can expand without a clearly identifiable probe, and a probe can be followed by more consolidation.
The course's interbank delivery or algorithm narrative can also be understood as a map of possible destinations. A transit map shows stations and connections; it does not prove which train must arrive next. No hidden program or participant mandate is verified merely by drawing levels on a chart.
Sessions supply context, not a script
The source material discusses Asian, London and New York sessions as different settings for activity. A useful study question is whether overlap, pace or range behavior changes across those settings for the instrument being examined.
Do not convert the examples into a timetable such as “Asia always consolidates” or “New York always reverses.” Instruments have different trading hours, and the same named session need not show the same behavior on different days. Session boundaries also require a stated timezone and attention to daylight-saving changes where applicable.
For a review, record the instrument, data source, date, chart timezone and session convention before applying a session label. Then describe the observed change. If there was no noticeable expansion at the boundary, keep that result. Time identifies the comparison window; it does not explain the move on its own.
Carry the question across timeframes
Open the same completed interval on a 15-minute, hourly and daily chart. First establish the range and swings separately on each. Then ask which smaller movements sit inside a larger one.
A sharp 15-minute departure could look like a small return on the daily chart. This is not a reason to choose whichever chart tells the preferred story. Write the scale explicitly: “Expansion on the 15-minute chart within a daily range.” Similar vocabulary across scales does not prove identical participants or mechanisms across scales.
Revisit OB and FVG with better questions
Unit 001 introduced a departure area and a displacement-related gap. This unit adds a review sequence:
- Identify the original range and the movement that makes an OB or FVG relevant.
- Note its position relative to the larger range and visible highs or lows.
- Record whether a later return reaches, overlaps or passes through it.
- Compare the subsequent structure with the interpretation written beforehand.
- Preserve passages through both regions and moves that never return.
This is an observation workflow. It does not grade a colored rectangle as an automatic trigger. A reaction at a region shows that price changed there; it does not establish that the same institution defended a remaining order.
Evaluate a story as carefully as a chart
The source notes encourage readers to question public commentary. Apply the same standard to this framework: what observation supports the explanation, what alternative fits, and what could show the explanation was inadequate?
An indicator describes a transformation of its input data. A participant story describes a proposed mechanism. Neither becomes a complete account of price formation simply because it sounds persuasive. Treat a commentator's incentives as a question to investigate, not an excuse to assume deception.
Short review
1. A prior high is exceeded and price returns. Which sentence is strongest: “the high was exceeded,” “orders may have clustered there,” or “a dealer deliberately trapped buyers”?
Sample reasoning: The first is directly observable. The second is a framework hypothesis. The third adds identity and intent that the chart does not establish. The later outcome does not eliminate that evidence gap.
2. Your session example does not show the expected boundary test. What belongs in the journal?
Sample reasoning: The actual price sequence, with the same session convention and timeframe. I would not shift the window or rename a minor fluctuation just to preserve the expected pattern.
3. An OB and FVG overlap near a prior high. Are there three independent confirmations?
Sample reasoning: Not necessarily. The first two may arise from the same displacement, and the high is contextual. I need to explain each relationship rather than count labels as votes.
Continue learning
Next: Unit 003 — Balance and the Observation Journal. It turns these distinctions into a repeatable record of what changed and what remains uncertain.
Optional reading: Liquidity Pool and False Breakouts at Key Levels. Return to the course hub.
This lesson studies explanations of market behavior. Its scenarios do not supply trading recommendations or establish institutional intent.