
ICT 2016 Unit 023: Trendlines as Liquidity Maps
Review repeated trendline touches through crowd expectations, nearby stop liquidity and post-breakout response without treating geometry as a signal.
A trendline is a shared visual reference. It can reveal where many observers may place orders and stops, but the line itself does not create support or resistance.
The third touch is a question
Repeated touches often increase confidence in the line and concentrate behavior around it. The third touch is therefore useful as a review checkpoint: what liquidity may sit beyond the line, and did the next move persist or return?
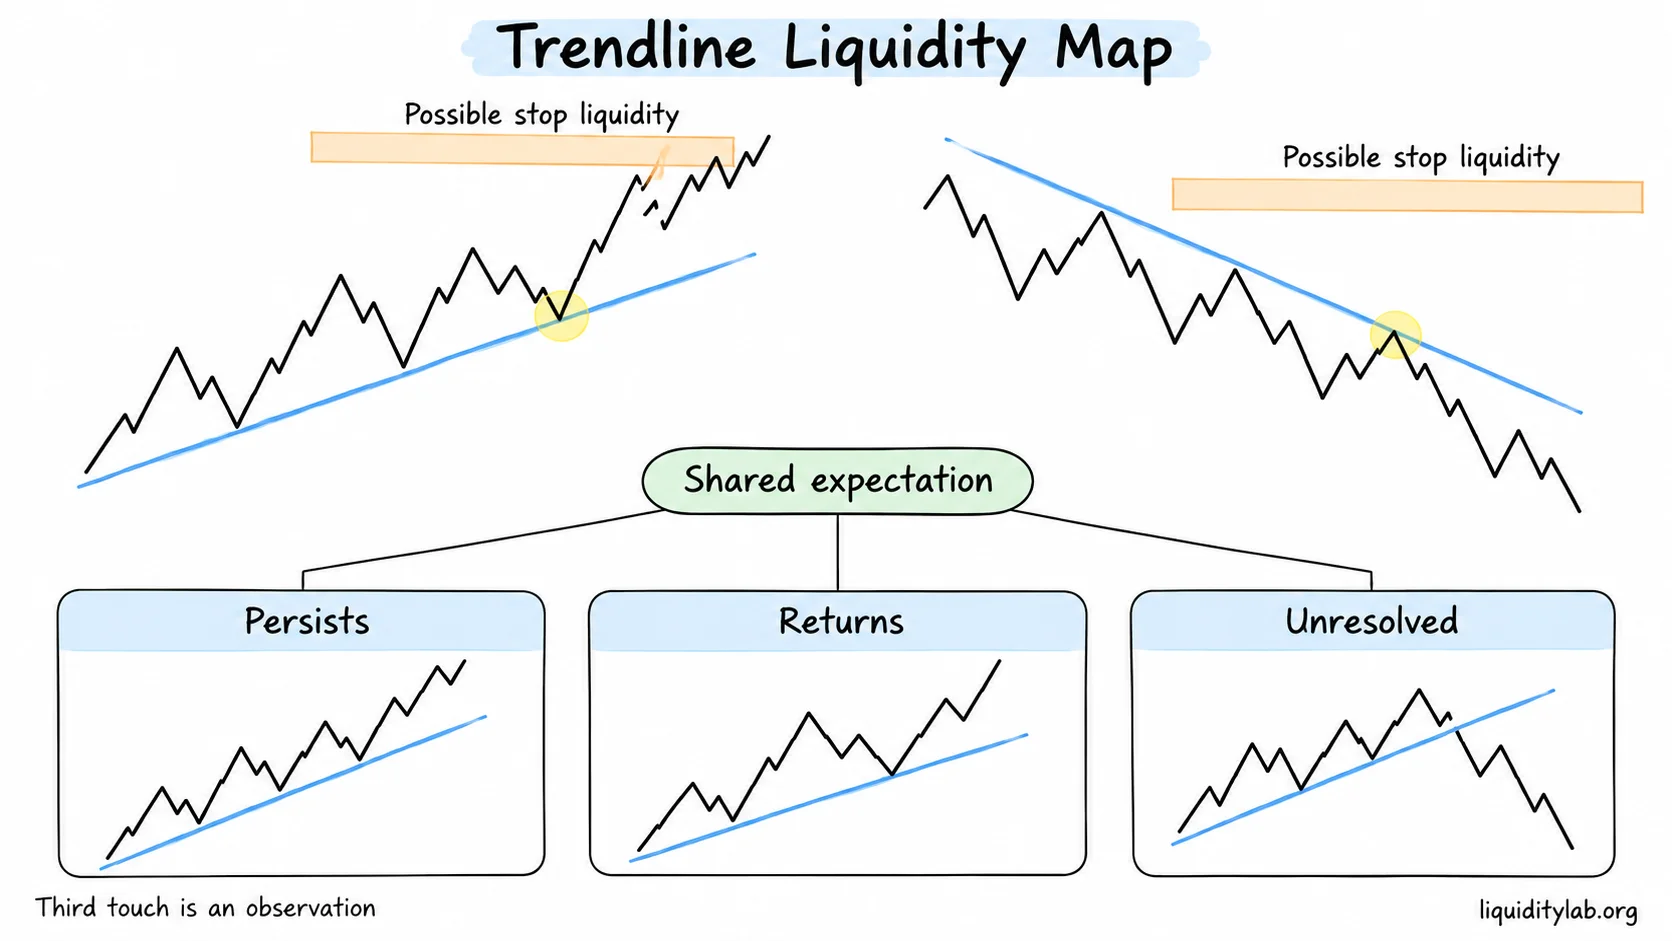
The line maps shared expectations; the later response supplies the evidence.
Two false-support stories
An ascending line can attract buyers whose stops sit beneath it. A descending line can attract sellers whose stops sit above it. A brief break may release that liquidity, but it may also simply continue. Do not convert a crowd-behavior hypothesis into a mechanical reversal rule.
Review exercise
Hide the candles after several repeated touches. Mark the line, likely stop locations and nearby higher-timeframe references. Reveal the next move and classify it as persistence, return or unresolved evidence.
Learning boundary
Trendlines are observation aids. They do not provide entries, stops, targets or proof of market-maker intent. Continue with Unit 024: Head-and-Shoulders Traps to compare another familiar shape with its surrounding liquidity.