
ICT 2016 Unit 003: Balance and the Observation Journal
Understand balance, imbalance and boundary tests, then use a multi-timeframe journal to separate observations, ICT interpretations and unresolved questions.
A quiet chart is not an empty chart. Repeated movement inside a range is information about where price is trading, even when it offers no clear directional conclusion.
Unit 001 introduced the four states. Unit 002 separated chart evidence from participant stories. This lesson brings them together: define a balance area, observe what happens at its edges, and keep a journal that allows your interpretation to change.
A weekend market
Imagine a weekend market where shoppers and sellers keep agreeing on prices within a familiar band. Activity continues even though prices appear stable. A change in available stock or demand may eventually move transactions elsewhere.
This analogy makes two things easier to see. First, a stable range can contain active exchange. Second, a later departure does not tell us everything about the people who traded earlier. We cannot infer every shopper's plan from the final stall price.
On a chart, repeated overlap suggests that the selected area continues to organize trading. It does not prove equal urgency on both sides, a precise fundamental valuation, or coordinated institutional accumulation.
Balance is an area; equilibrium is a reference
A balance area is a selected range in which price repeatedly trades. Its boundaries depend on the timeframe, the interval under review and the swings used to define it. State those choices instead of treating the box as an objective feature with only one possible outline.
Equilibrium, as introduced in Unit 001, commonly means the midpoint of that chosen range. The midpoint is easy to calculate once the endpoints are fixed. It is not automatically where the most trading occurred, and it does not establish the asset's fair value.
For an illustrative example, imagine repeated movement through the lower half of a wide range. The arithmetic midpoint remains halfway between its endpoints, even if much of the visible overlap lies below it. A balance area and its midpoint answer different questions: “Where has price repeatedly traded?” and “Where is the middle of my selected range?”
If you redraw the range after seeing the outcome, the midpoint moves too. Save the original annotation and explain the revision so that the journal remains auditable.
Imbalance and repricing
When price leaves the area with relatively rapid, less overlapping movement, the framework describes imbalance or repricing. These words characterize a change in the price sequence. They do not mean that completed trades had no counterparties, nor do they prove a permanent change in value.
After a departure, observe the relationship to the old range. Continued trading outside suggests that the departure persists over the selected window. A quick return suggests that the first departure did not persist. Repeated crossing may leave the picture unresolved.
An isolated long candle does not settle which description will remain useful. Make the observation window explicit rather than use “accepted” as an unexplained stamp of certainty.
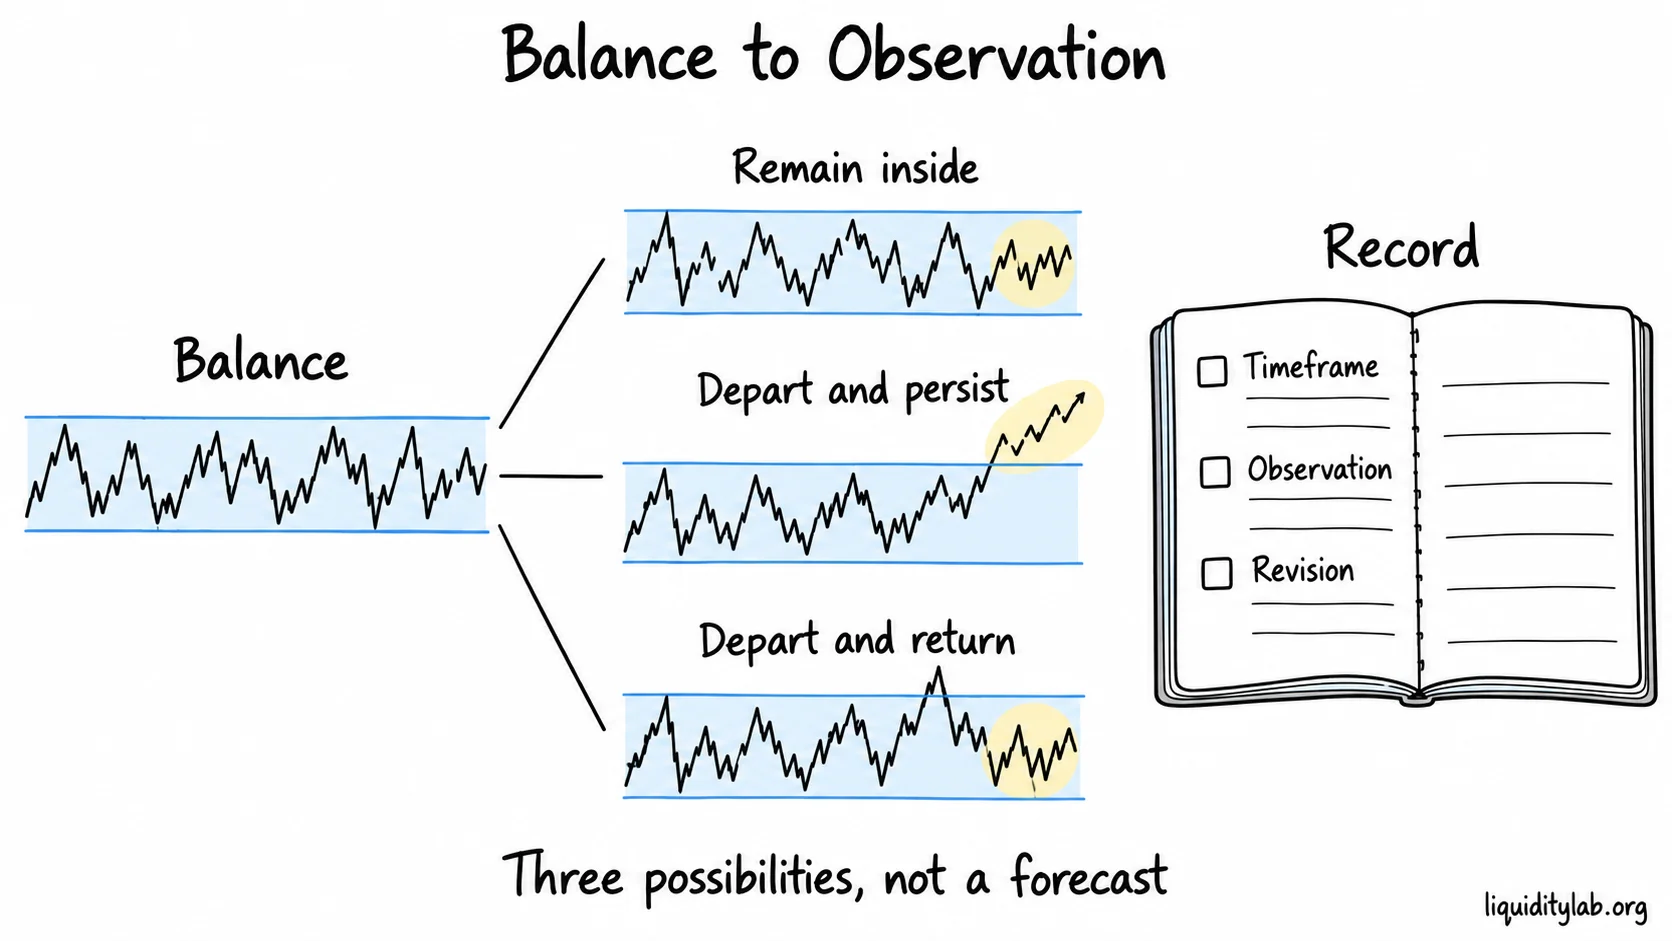
Keep alternative outcomes visible and record the observed result on a stated timeframe.
An illustrative boundary test
Imagine several daily candles overlapping inside a range. A later candle moves above the earlier high, then subsequent trading returns inside. Only afterward does a more sustained departure develop.
Write the sequence in four parts:
| Part | Example journal wording |
|---|---|
| Observable facts | The marked high was exceeded; later candles traded inside the original range again. |
| Framework interpretation | The high was a possible liquidity reference, and the excursion can be studied as a boundary test. |
| Working hypothesis | If subsequent movement remains outside a boundary, the range may become a less useful description of the current state. |
| Unknown | Which participants traded, whether they coordinated, and whether the next departure will persist. |
A counterexample begins with the same range but remains above it after the first departure. Another crosses both edges and continues overlapping. These alternatives matter because “a range exists” does not select the path that follows.
Calling every excursion a smart-money operation adds no testable detail. Ask whether the description would remain understandable if participant labels were removed.
Participant differences without a new mythology
The source notes contrast retail and institutional perspectives to highlight differences in resources, information and execution. The useful learning response is humility about what an outside observer can know.
“Retail” does not mean every individual thinks alike, and “smart money” does not mean every large participant is informed or successful. Neither label explains a particular candle by itself. Price, time and available transaction data are evidence; a claim about the owner of an order needs additional support.
The same caution applies to familiar habits. An “overbought” indicator label does not require price to reverse. Replacing that certainty with “institutions must reverse it” preserves the original mistake under a different name.
Build a journal from broad context to detail
The Chinese extension offers a practical set of chart windows. Retain them as starting points for study, not as optimized settings or a market law:
| Chart | Suggested visible history | Study question |
|---|---|---|
| Daily (D1) | About 9–12 months | Which larger ranges and swings surround the interval? |
| Four-hour (H4) | About 3 months | How does the current movement sit inside that context? |
| Hourly (H1) | About 3 weeks | Where are recent departures, returns and repeated overlaps? |
| Fifteen-minute (M15) | About 3–4 days | What sequence is hidden inside the larger candles? |
Choose a common endpoint so the charts describe the same moment. Note the instrument, feed, timezone, timeframe and visible interval. Save a screenshot before viewing later data if using replay. These details let you reconstruct what you could actually see.
Bring a few relevant higher-timeframe references onto the smaller chart, then check their relationships rather than assume the smaller chart must follow a single path. A daily range can contain several hourly expansions and reversals. Keep conflicting descriptions when they accurately describe different scales.
The source suggests recording areas of rapid departure, highs and lows not yet revisited, and nearby conspicuous highs or lows, including similar highs or lows. Treat “not yet revisited” as relative to your data window. An apparent equal high is a visual comparison, not a measurement of the orders above it.
A compact observation record
Use the following structure for one completed interval:
- Context: instrument, date range, data source, timezone and chart scale.
- Reference: selected range endpoints, important swings and the reason for selecting them.
- Sequence: overlap, departure, return, further progress or unresolved crossing.
- Interpretation: the ICT terms that describe the sequence and an alternative explanation.
- Revision: what later observation strengthened or weakened the original description.
- Unknowns: order ownership, motive and outcomes beyond the review window.
Keep an annotated study chart and a simpler copy with only the essential references. This makes it easier to notice when accumulated labels are obscuring price. The exercise is about review, so an execution chart is unnecessary.
When using a previous day's high and low, specify what defines the day. A midnight GMT boundary is one convention mentioned in the source, not a universal reset in market behavior. Changing the timezone or session convention can change the resulting candle and reference levels.
Calendar examples are hypotheses
The source includes a Wednesday-high and Friday-liquidity-touch example. It has no documented sample here that would justify a frequency or reliability claim. Treat it as a question to test on completed weeks, not a schedule to expect.
Before looking at outcomes, define what counts as Wednesday, which high is used, and what constitutes a later touch. Select consecutive weeks rather than only memorable matches. Record weeks where the level is never touched, where it is crossed and movement continues, and where it is crossed and price returns.
This does not establish a trading edge. It prevents a vivid example from becoming an unfalsifiable story. A mismatch is evidence about the example's limits, not a reason to keep changing its definition.
Replace prediction with conditional observation
Prediction becomes a problem when the desired result controls the description. Conditional observation begins with a reference and keeps multiple outcomes open.
For example: “Price is approaching the range high. I will record whether it remains inside, moves outside and persists, or moves outside and returns.” Afterward, describe which occurred and over what interval. This is a plan for collecting evidence, not for placing an order.
The improvement is visible in the journal: fewer statements about what must happen, clearer reference choices, and revisions that explain what changed. The goal is not to rename every mistake as a new pattern.
Short review
1. Is the middle of your range necessarily its busiest trading area?
Sample reasoning: No. The midpoint depends on two endpoints. Repeated overlap or measured trading activity may be concentrated elsewhere. I should specify which idea I mean by “balance.”
2. A daily range contains an hourly reversal. What belongs in the record?
Sample reasoning: Both descriptions, with their reference swings and timeframes. The smaller change need not end the larger range. I would examine its position within that range before assigning broader meaning.
3. A reviewed week does not match the Wednesday/Friday example. What should you do?
Sample reasoning: Keep it in the sample, using the same date and level definitions. Explain the actual path without inventing participant motives or excluding the week because it is inconvenient.
4. How can a journal show learning even when a hypothesis fails?
Sample reasoning: It preserves the earlier evidence, records the conflicting observation and shows a justified revision. A correct process can include an incorrect initial interpretation.
Continue learning
This completes the first three units in the English pilot. The next English lesson is the ICT / SMC Learning Path for Beginners, which places these foundations in a broader sequence. Later numbered ICT 2016 units are not included in this pilot.
For an optional deeper definition of range-relative position, see Premium / Discount Array — Pro. You do not need it to complete the journal above. Return to the course hub.
These exercises develop observation and review. They do not prescribe market direction, execution parameters or expected returns.