
ICT 2016 Unit 021: Cross-Market Structure and Divergence Warnings
Compare related markets for symmetry and divergence as a warning layer while keeping correlation, causation and participant intent separate.
A single chart can look convincing while a related market tells a different story. Cross-market structure adds a comparison layer: it can strengthen a description or raise a warning, but it cannot prove why the markets moved.
Compare the same window
Choose two related instruments and align the observation window. Mark their relevant highs and lows before deciding whether the relationship is symmetric. A new extreme in one market without a corresponding move in the other is a divergence warning, not an automatic reversal signal.
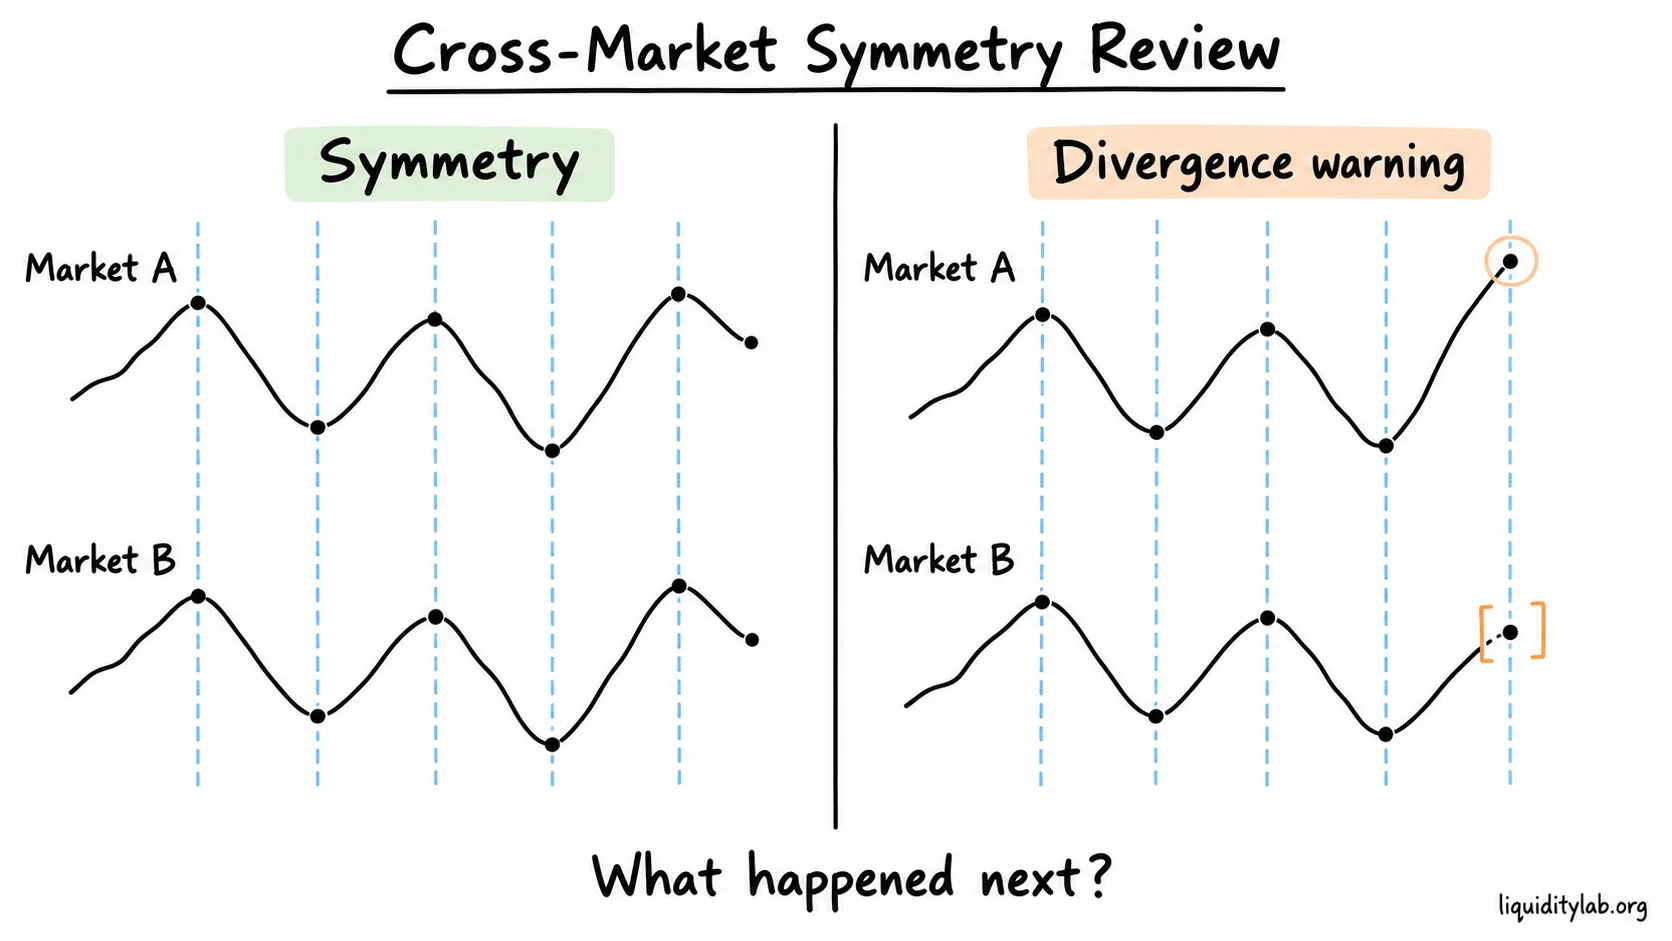
A cross-market mismatch changes the questions to ask; it does not supply a trade instruction.
Three comparison questions
- Did both markets complete the expected opposing or matching swing?
- Did the mismatch occur near a meaningful range or liquidity reference?
- What did price do after the mismatch: persist, return or remain unresolved?
Keep the relationship conditional. Correlation can weaken, shift or disappear across instruments and time periods. A divergence may last longer than expected or fail to matter to the next move.
Review exercise
Hide later candles on both charts. Record the shared window, matched extremes and any mismatch. Write one interpretation that supports continuation and one that warns of weakening. Reveal the later path and score the quality of the evidence, not just the outcome.
Learning boundary
Cross-market structure is a comparison tool. It does not provide entries, stops, targets, probabilities or certainty about institutional behavior. Continue to the broader ICT / SMC Learning Path after keeping the relationship and its uncertainty in your journal.