
ICT 2016 Unit 038: Double Tops, Double Bottoms and Liquidity Maps
Review equal highs and lows as visible liquidity references, then compare sweeps, structure and later response without treating them as reversal answers.
A double top or double bottom is an easily recognized reference, not a reversal verdict. Repeated highs and lows can make orders cluster around a visible boundary. The useful review asks what happened around that boundary and what the later response confirms.
Equal highs and lows are visible references
Mark the repeated high or low, the range around it and the timeframe that makes the pattern visible. A clean pair can attract shared expectations, but it does not reveal participant intent or guarantee a sweep.
Planned diagram position: after ## Equal highs and lows are visible references and before ## What sits beyond the boundary.
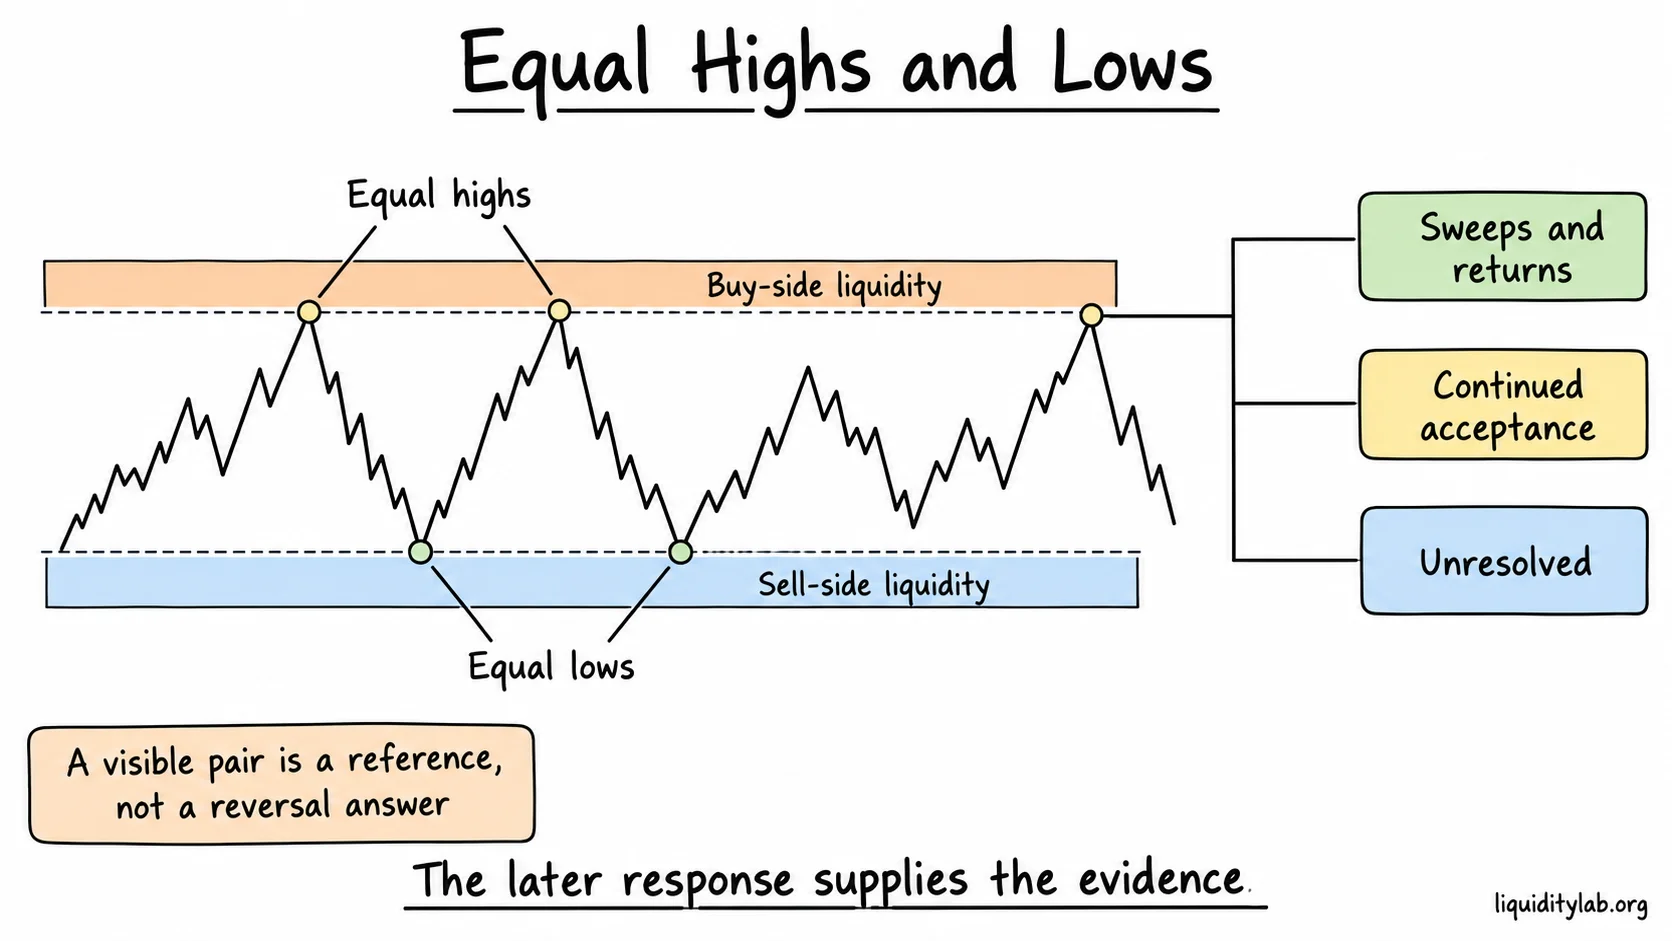
Repeated levels organize the review; the later response determines what they established.
What sits beyond the boundary
Above a visible high may be protective buy stops and breakout orders; below a visible low may be protective sell stops and breakdown orders. Treat these as a liquidity explanation to compare with the chart, not as proof that the market is targeting a specific trader.
A sweep changes the question
A brief excursion beyond the pair can return, continue accepting or remain unresolved. Record the excursion, body closes, displacement and nearby FVG or order-block candidates separately. A return is evidence about the response, not proof of a planned reversal.
Range position matters
The two sides of a range carry different information from its middle. Compare the double top or bottom with higher-timeframe structure, nearby pools and the path already travelled. A pattern in the middle of a range should not be given the same weight as a boundary test.
Review sequence
- Mark the repeated highs or lows and the selected timeframe.
- Describe the range and the approach to the boundary.
- Note the liquidity explanation above or below the reference.
- Record whether price swept, held, returned or accepted beyond it.
- Compare any FVG or order-block reaction with the larger structure.
- Write the observation that would weaken the reversal explanation.
A repeated doorway
Equal highs and lows are like a doorway that many people notice and approach from the same side. The doorway maps shared expectation; the later crossing or rejection tells you what the chart actually established.
Misconceptions: equal levels are not reversal answers; a sweep is not proof of a planned route; symmetry does not create probability.
Review exercise
Choose two completed double-top or double-bottom examples and one failed pattern. Hide the later candles, write two competing explanations, then reveal the response. Include one case where the equal levels remained untouched during the review window.
Short review
1. The equal high is swept and price returns. Sample reasoning: record the excursion and return, then test whether the next structure supports a reversal explanation.
2. The levels remain untouched. Sample reasoning: keep the liquidity map as unresolved during the review window.
Learning boundary
Double tops and double bottoms do not provide automatic entries, stops, targets, probabilities or reversal certainty. Continue with Unit 039: Quarterly IPDA and Market Rhythm to place visible liquidity inside a wider time window.
Review questions
- Which timeframe makes the repeated levels visible?
- What did the first boundary test establish, and what remained unknown?
- Did price sweep, return, persist or remain unresolved?
- Which counterexample prevents treating the pattern as a reversal rule?