
ICT 2016 Unit 017: Choosing a Timeframe for the Question
Use higher, middle and lower timeframes for different observation tasks while keeping context, noise and personal availability visible.
Timeframe selection is a question-design problem. A monthly chart, a daily chart and an intraday chart can describe the same market while answering different questions. No timeframe is universally superior.
Match the window to the task
Higher timeframes provide wider context and fewer observations. Middle timeframes help compare structure and location. Lower timeframes expose detail but also add noise and more opportunities to overreact.
Write the task before opening the chart:
- Context: What larger range or directional condition is visible?
- Structure: Which swings, boundaries and gaps deserve review?
- Detail: What happened around the selected area during the observation window?
A three-layer workflow
Start with the higher timeframe to describe the background. Move to the middle timeframe to mark the range and competing explanations. Use the lower timeframe only to inspect how price interacted with that selected area.
The lower timeframe may add detail, but it cannot erase an unfinished higher-timeframe observation. If the layers disagree, record the disagreement instead of forcing a single story.
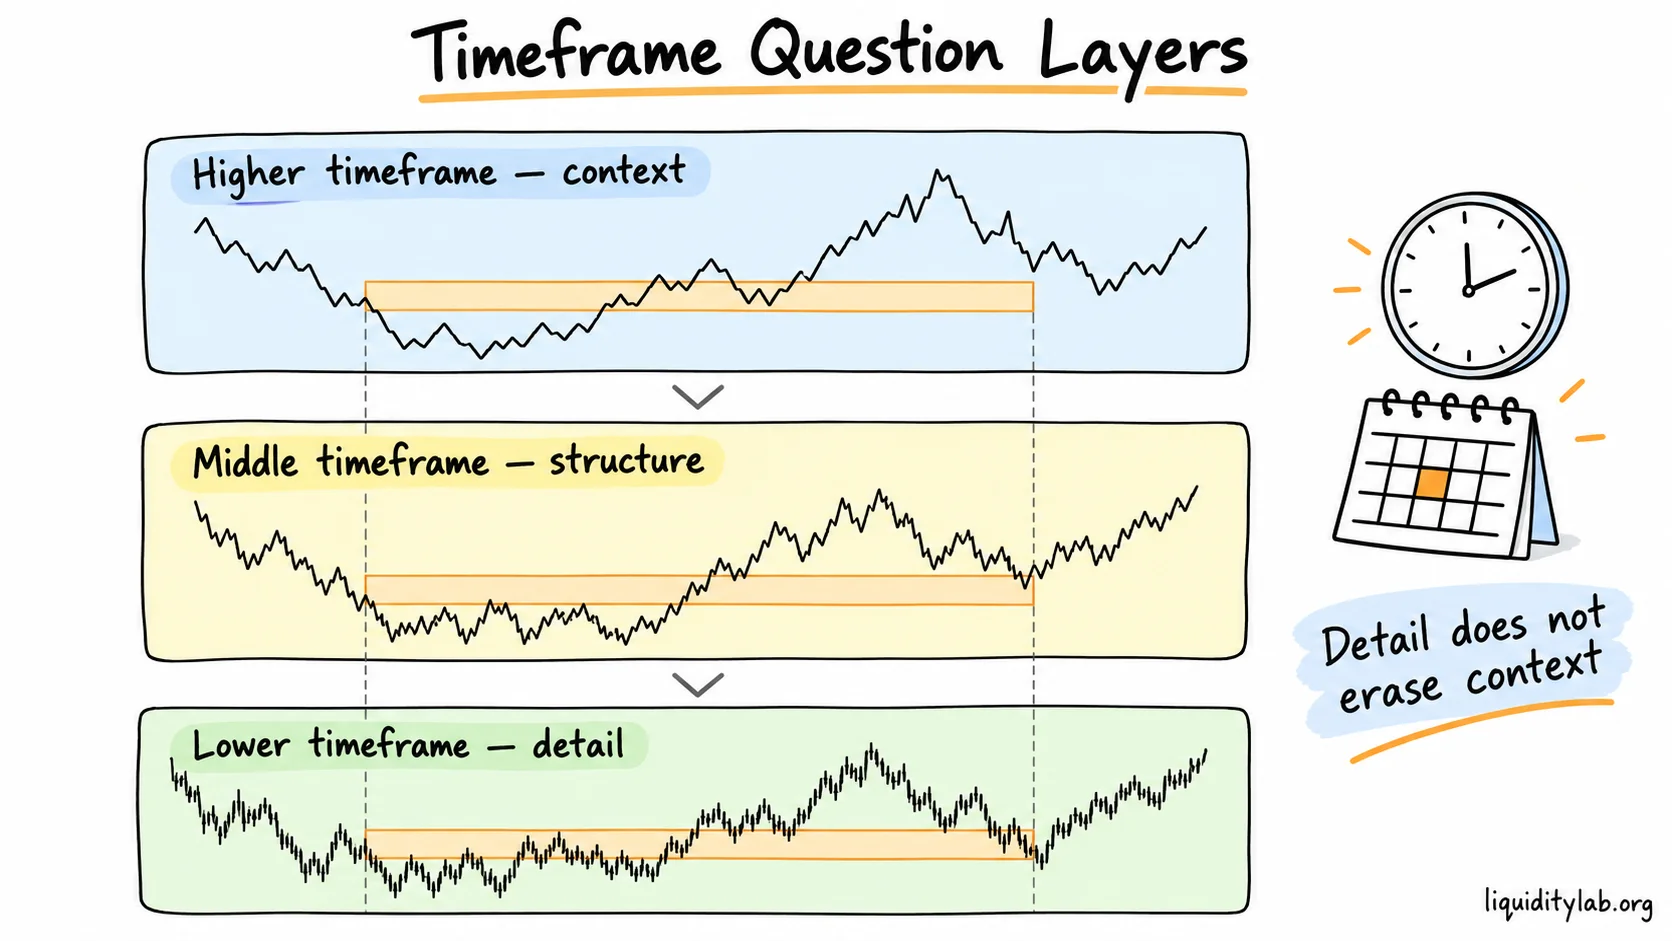
These schematic layers illustrate different questions, not a reconstruction of one price series.
Match the window to real life
The best study window is one you can review consistently. A person with limited screen time may learn more from a daily or weekly sample than from a fast chart that cannot be revisited. Speed is not the same as information quality.
Review exercise
Choose one completed move and write a three-line description: higher-timeframe context, middle-timeframe structure and lower-timeframe reaction. Then repeat the exercise with the lower layer hidden. Note which claims disappear when detail is removed.
Learning boundary
Timeframe choice does not guarantee a result and does not replace a risk plan. It only defines the scale of the observation. Continue with Unit 018: Institutional Order Flow to connect scale with liquidity paths.