Price Action Reading Basics
Learn price action as an observation language for candle sequences, trend bars, non-trend bars, overlap, expansion, and market state.
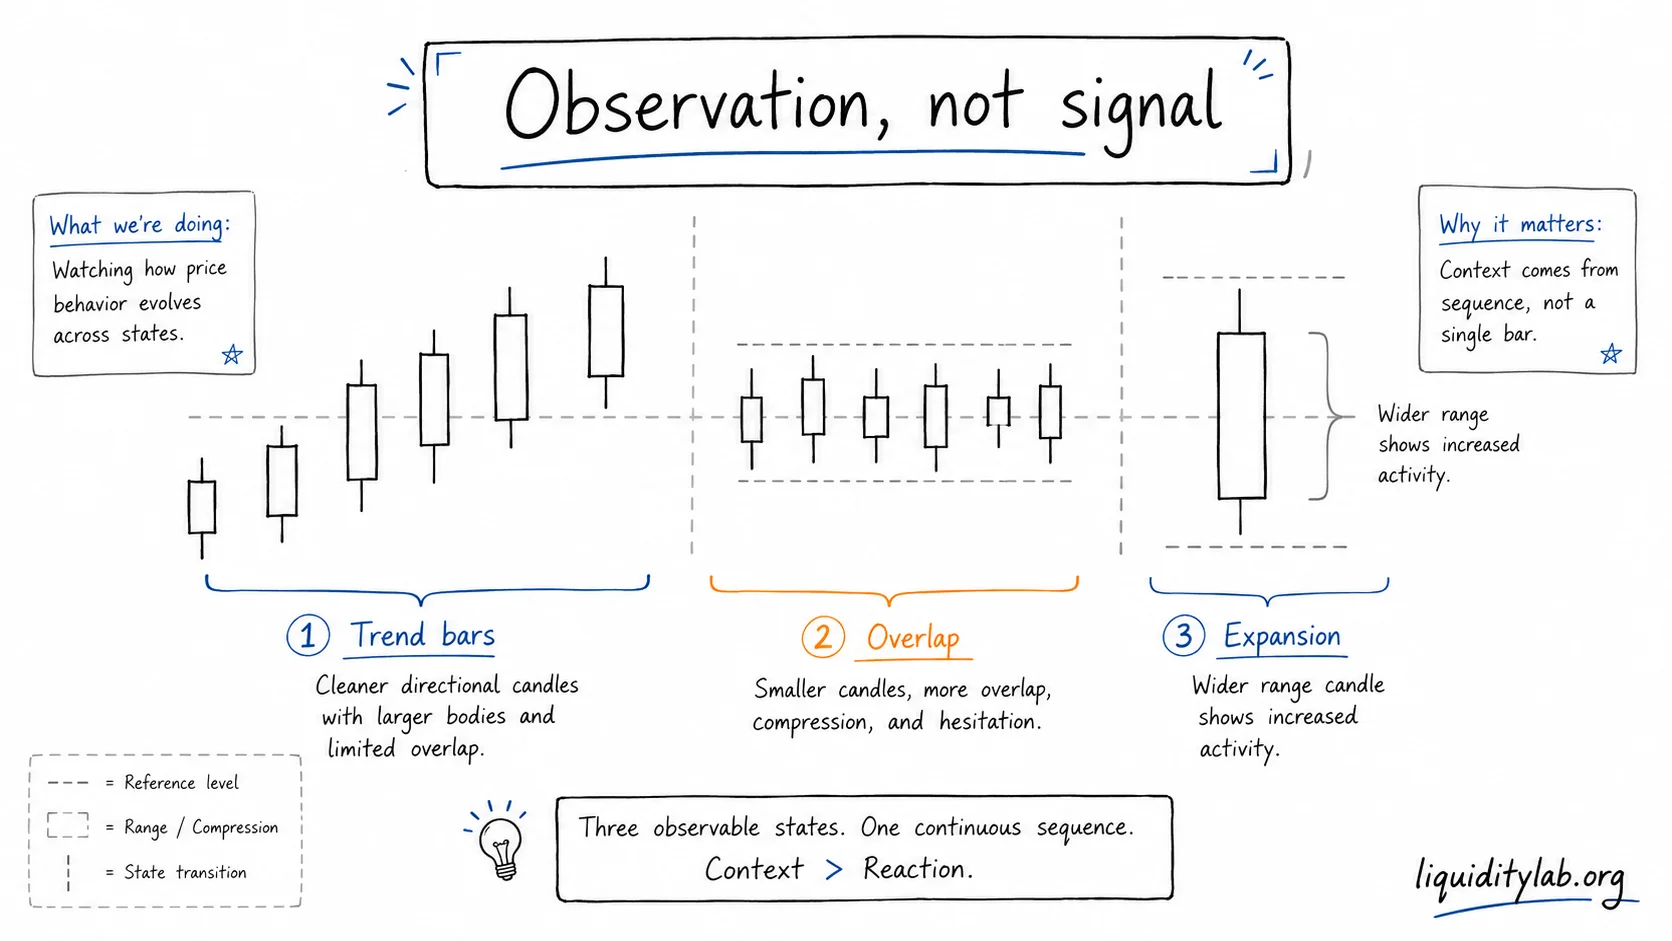
Price action reading is not a shortcut to prediction.
It is a way to describe what price is doing through candle sequences.
Instead of asking, "Which candle pattern guarantees the next move?", price action reading asks a simpler question:
What is the current sequence telling us about market state?
From single candles to sequences
Many traders first learn candles one at a time: doji, hammer, engulfing candle, pin bar, large body, long wick.
Those names can be useful. But a single candle only becomes meaningful inside a sequence.
A large bullish candle after a long advance does not mean the same thing as a large bullish candle after a long range. A long upper wick near a major level does not mean the same thing as a long upper wick in the middle of a noisy area.
The first step is to move attention from:
What is this candle called?
to:
Where does this candle sit in the sequence?
Trend bars and non-trend bars
One useful simplification is to separate candles into two broad types.
Trend bars have larger bodies, shorter wicks, and less overlap with nearby candles. They show that price moved with clearer direction during that period.
Non-trend bars have smaller bodies, longer wicks, and more overlap with nearby candles. They show hesitation, conflict, or reduced directional progress.
This distinction is more useful than simply asking whether a candle is green or red. A few non-trend bars inside a strong trend do not automatically end the trend. One trend bar inside a range does not automatically start a trend.
The key is the proportion and sequence:
- Are trend bars becoming more frequent or less frequent?
- Is overlap increasing or decreasing?
- Is price moving cleanly or rotating in place?
Signal candles as observation clues
The phrase "signal candle" can be misleading if it is treated as an action command.
In LiquidityLab's language, a signal candle is better understood as an observation clue: one candle or a group of candles that makes a location worth watching.
A hammer near a meaningful lower area may say, "Pay attention here." It does not say, "Enter now."
The value of a signal candle depends on:
- location
- prior sequence
- market state
- follow-through
- relation to key levels or liquidity
Without context, a signal candle is just a shape.
Observation clue vs system component
It helps to separate two ideas that are often mixed together.
Observation clue means a candle or candle group that highlights a possible change in behavior. Its job is to draw attention.
System component means a later structural element that a specific model may use as part of a plan. Some price action models use terms like entry bar or confirmation bar for this layer.
The distinction matters because seeing an observation clue is not the same as having a complete plan.
For learning purposes:
- observation clue answers "what is worth watching?"
- system component answers "what would this model require before planning?"
This page focuses on the first layer.
Contraction and expansion
Price action is not only about candle names. It is also about how candles relate to each other.
Contraction appears when the current candle's range sits inside the previous candle's range, or when several candles compress into a narrower area. This shows reduced activity or hesitation.
Expansion appears when the current candle's range extends beyond the previous range, or when volatility increases. This shows increased activity.
Neither contraction nor expansion tells you direction by itself.
They describe rhythm.
Overlap
Overlap is one of the simplest ways to read market state.
When many candles overlap, price is moving back and forth in the same area. That often reflects uncertainty, balance, or range behavior.
When candles overlap less and move cleanly away from one another, price is showing clearer directional progress.
The important observation is not overlap itself. The important observation is change:
- Is overlap increasing?
- Is overlap decreasing?
- Did a clean sequence become messy?
- Did a messy sequence start to move cleanly?
Those changes can tell you that market state may be shifting.
Waiting for the candle to close
A candle is not complete until it closes.
Before the close, a candle's body, wick, and final shape can change. A candle that looks strong during its formation may close weak. A candle that looks weak may recover before the period ends.
For stable observation:
- do not treat an unfinished candle as a completed structure
- do not treat intrabar movement as confirmed state change
- use the close to reduce noise, not to find an entry
Completed candles are not perfect, but they are more reliable observation units.
Position labels in a sequence
Some price action models use simple position labels to describe swings in a trend.
In an up sequence, pushes may be labeled high 1, high 2, high 3, with pullbacks between them. In a down sequence, the labels are mirrored.
These labels are not magic counts. Their purpose is descriptive:
- they help locate where a move may be in its sequence
- they help compare the strength of one push with another
- they give traders a shared language for review
Counting alone does not create an action signal.
What price action reading is for
Price action reading helps you describe:
- whether price is moving or hesitating
- whether candles are expanding or contracting
- whether overlap is increasing or decreasing
- whether a candle is a clue or just noise
- whether market state looks more like trend, pullback, range, or transition
It does not decide entries, exits, stops, targets, leverage, or position size.
Those belong to separate risk and execution systems. This page stays in the observation layer.
Continue with
- The Five Elements of a Candlestick
- Candlestick Emotion Language
- Market Structure Basics
- Trading Range Structure
Educational content only. Not financial advice.