Elliott Wave Driving Structures
Learn Elliott Wave driving structures as textbook classification models for impulse waves, leading diagonals, and ending diagonals.
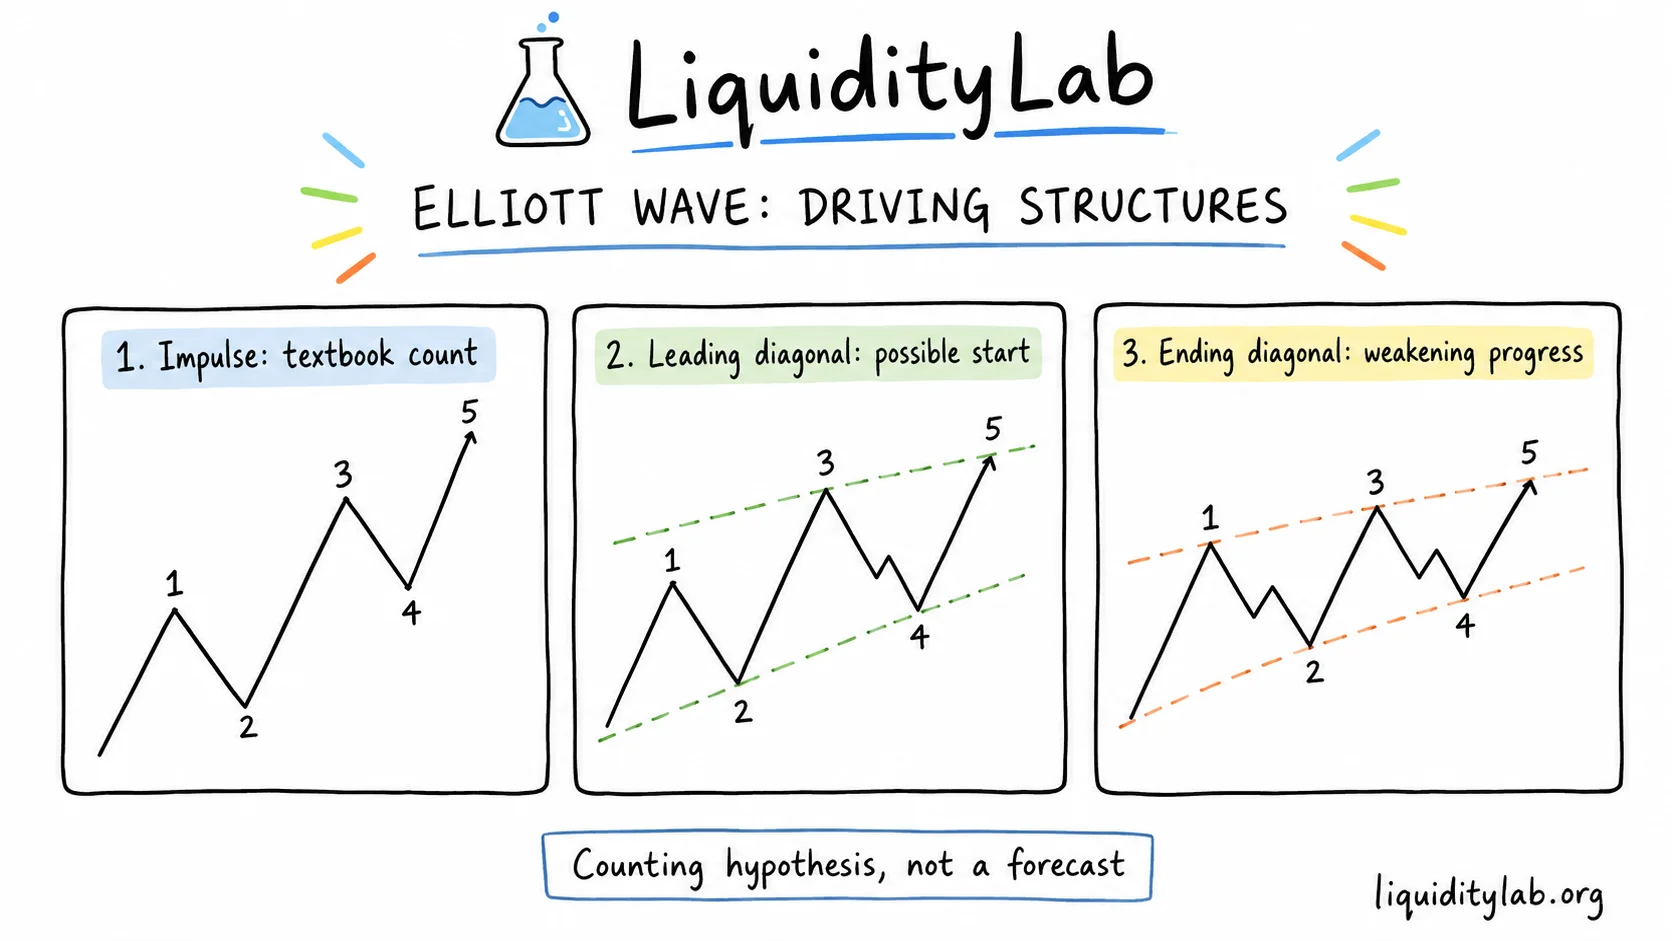
Elliott Wave is a classic framework for describing market structure through wave counts.
In LiquidityLab, Elliott Wave belongs to the Framework Mapping layer. It can help describe a possible structure, but it does not replace the Market Structure OS and it does not provide buy direction, sell direction, entries, exits, stop placement, targets, position sizing, leverage, or return expectations.
The safest way to read Elliott Wave
Elliott Wave is often misused as a forecasting system.
LiquidityLab uses a safer interpretation:
a wave count is a structure hypothesis, not a market command.
That means each count remains provisional. If later price behavior does not fit the count, the count is revised or abandoned. The market is not "wrong" for failing to follow a textbook model.
The basic 5 + 3 teaching model
Many Elliott Wave introductions describe a full cycle as:
5 driving waves + 3 corrective wavesThe driving side is usually labeled:
1 - 2 - 3 - 4 - 5The corrective side is usually labeled:
A - B - CThis page focuses only on driving structures. Corrective structures are covered in the companion page.
Degree: nested structure, not precision
Elliott Wave uses the idea of degree to describe nested structure.
A larger wave can contain smaller waves, and those smaller waves can contain even smaller waves.
The useful part is that degree gives you a language for nested structure.
The dangerous part is over-counting. If every small fluctuation becomes a new wave degree, the chart can become less clear rather than more clear.
For learning, it is usually safer to keep only a few degrees in view and ask:
- Which structure is obvious?
- Which count is only being forced after the fact?
- What would invalidate this count?
Impulse wave
The impulse wave is the most common textbook driving structure.
It is usually described as a five-wave structure:
1 - 2 - 3 - 4 - 5Textbook explanations often mention three definition rules:
- Wave 2 should not retrace beyond the start of wave 1.
- Wave 3 should not be the shortest of waves 1, 3, and 5.
- Wave 4 should not overlap the price area of wave 1 in a classic impulse model.
These are not laws of market behavior.
They are definition rules inside a textbook model. If price violates them, the safer conclusion is not "the market broke the rule." The safer conclusion is:
this wave count may no longer be a valid classic impulse count.
Extension and alternation
Some Elliott Wave material describes one of waves 1, 3, or 5 as an extended wave.
An extension means that one driving wave contains a more visible internal five-wave structure.
This can be useful in replay, but it is highly dependent on where the observer starts counting. Different observers may identify different extensions.
The principle of alternation is another common textbook idea. It suggests that if wave 2 is sharp, wave 4 may be more sideways, and if wave 2 is sideways, wave 4 may be sharper.
In LiquidityLab language, alternation is a comparison lens:
Are the two pullbacks structurally different?
It is not a promise about what the next pullback must become.
Leading diagonal
A leading diagonal is a textbook driving structure often discussed near the beginning of a larger move, such as wave 1 or wave A.
It is usually drawn as a converging wedge-like structure.
Common textbook descriptions may label its internal rhythm as:
5 - 3 - 5 - 3 - 5The useful observation is location:
- Does the wedge-like structure appear near a possible structural beginning?
- Does price behavior after the structure show continuation, rejection, or uncertainty?
- Is the internal count clear, or is it being forced?
A leading diagonal label does not mean a new trend is confirmed.
Ending diagonal
An ending diagonal is a textbook driving structure often discussed near the end of a larger move, such as wave 5 or wave C.
It is also often drawn as a converging wedge-like structure.
Common textbook descriptions may label its internal rhythm as:
3 - 3 - 3 - 3 - 3The observation value is that repeated pushes inside a narrowing structure may suggest weakening progress.
But weakening progress is not a reversal guarantee.
An ending diagonal label should not be treated as a top or bottom signal.
Why wave counts disagree
Elliott Wave is subjective because several choices depend on the observer:
- where the count starts
- which swing is meaningful enough to label
- which degree is being tracked
- whether a messy move is a valid structure or noise
- whether a rule violation invalidates the count or changes the degree
This is why two reasonable observers can count the same price path differently.
That disagreement is not a bug to hide. It is part of the method's boundary.
Mapping back to Market Structure OS
Before applying Elliott Wave labels, LiquidityLab asks:
- What is the current market state?
- What visible highs, lows, ranges, and breaks are actually present?
- Where is liquidity likely clustered?
- What evidence supports the current reading?
- What would invalidate the reading?
Only after that should Elliott labels be used as a framework translation.
If the structure is unclear, a wave label does not make it clear.
Summary
Elliott Wave driving structures are useful as textbook classification models.
Impulse waves, leading diagonals, and ending diagonals can help describe possible structure. They should not be used as forecasts, trade signals, or proof that price must follow a numbered path.