The Five Elements of a Candlestick
Learn the five basic parts of a candlestick and how to read them as a compact record of price movement, not as a trade signal.
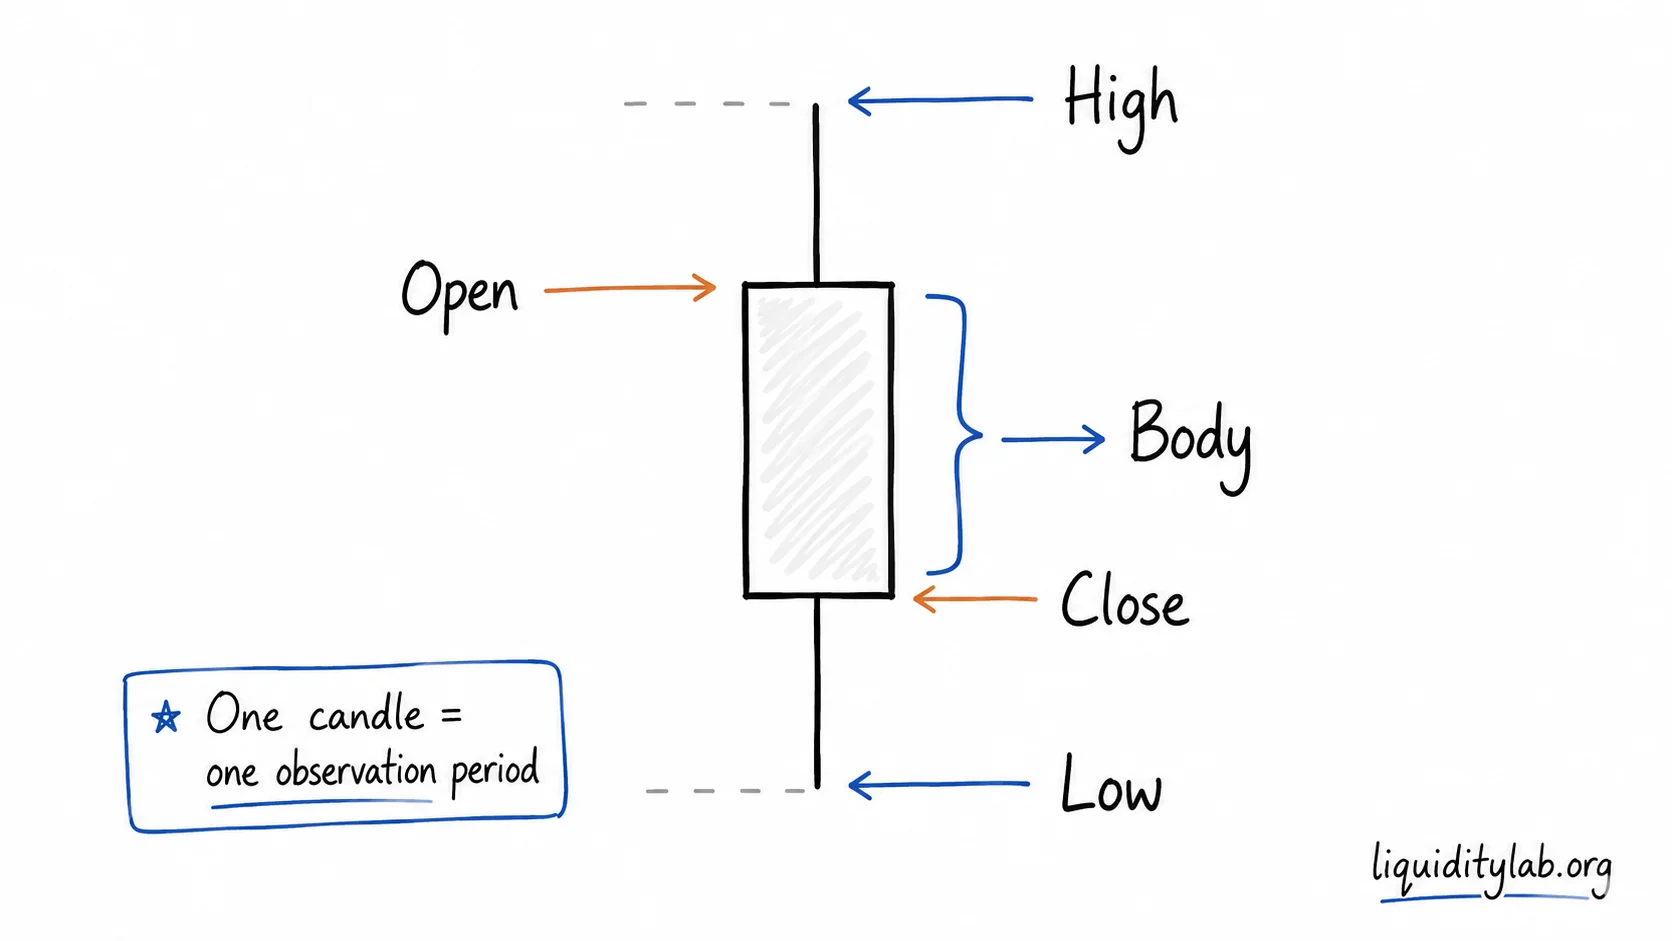
A candlestick is not a prediction.
It is a compressed record of what price did during one period of time.
On a daily chart, one candle records one day. On a 15-minute chart, one candle records 15 minutes. The shape changes with the timeframe, but the basic information is always the same.
The five elements
Every candlestick has five basic elements:
- open
- close
- high
- low
- body
Learning these five elements is the first step toward reading price action without turning every candle into a signal.
Where candlesticks come from
Candlesticks began as a way to record a trading period in a compact visual form.
The format is useful because it compresses movement into a few stable facts. That is also why many trading systems can reuse the same candle language while interpreting it differently.
Instead of listing every individual price change, one candle compresses the period into a few observable facts: where price began, where it finished, how far it pushed upward, how far it pushed downward, and how much distance remained between the open and the close.
That origin matters because it keeps the tool in the right place.
A candle is a record format. It is not a prediction engine. The more useful question is not "what does this candle tell me to trade?" but:
What did this period of price movement leave behind?
Open: where the story begins
The open is the first traded price of the candle's timeframe.
It gives the candle a starting point. But the open does not explain the whole candle by itself. A candle that opens high and then sells off tells a different story from one that opens high and continues higher.
The open only becomes meaningful when compared with the close, the high, the low, and the surrounding candles.
Close: where the story ends
The close is the final traded price of the candle's timeframe.
If price closes above the open, the candle often appears as an up candle. If price closes below the open, it often appears as a down candle.
The close matters because it tells you where price finished after the full period of movement. A strong-looking candle before the close can change completely before the candle is finished. That is why completed candles are more stable observation units than still-forming candles.
High: the upper extreme
The high is the highest price reached during the candle.
It shows how far price was pushed upward during that period. But a high is not automatically strength. If price reached a high and then closed far below it, the upper area may have been rejected during that period.
The high is best read together with the upper wick and the close.
Low: the lower extreme
The low is the lowest price reached during the candle.
It shows how far price was pushed downward during that period. But a low is not automatically weakness. If price reached a low and then closed far above it, the lower area may have been rejected during that period.
The low is best read together with the lower wick and the close.
Body: the net result
The body is the distance between the open and the close.
A larger body often means price moved with clearer direction during that period. A smaller body often means the period ended closer to where it began.
This does not mean a large body is always "good" or a small body is always "bad." The body only describes the net result of that candle. The surrounding structure decides how useful that information is.
Wicks: the trace of rejection
Although wicks are not part of the five-element list, they are essential for reading a candle.
An upper wick shows that price traded higher during the period but did not close at that high. A lower wick shows that price traded lower during the period but did not close at that low.
Long wicks can show conflict, rejection, or volatility. Short wicks can show cleaner movement. But wicks are context-dependent. A long wick inside a noisy range does not mean the same thing as a long wick at a major level.
Same candle, different location
The same candlestick can mean very different things depending on where it appears.
A large up candle after a long decline may show a first reaction from buyers. The same large up candle after a long advance may show emotional acceleration near the end of a move. A small indecision candle in the middle of a range may be ordinary noise. The same candle after a sharp push may show hesitation.
This is why candlestick reading should begin with a simple question:
Where is this candle located inside the larger structure?
Timeframe matters
Every candle belongs to one timeframe.
A strong daily candle may contain many smaller intraday swings. A confusing lower-timeframe sequence may combine into one clear higher-timeframe candle.
When discussing candles, always state the observation timeframe. Without a timeframe, candle descriptions become vague.
What this page is not
This page does not teach candlestick entries, exits, stop placement, targets, or position sizing.
The five elements are a reading vocabulary. They help you describe what happened inside one candle. They do not tell you what to do next.
Continue with
Educational content only. Not financial advice.