How to Find Key Levels
Use a practical top-down process to find key levels by starting with higher timeframes, clear swings, and repeated reactions.
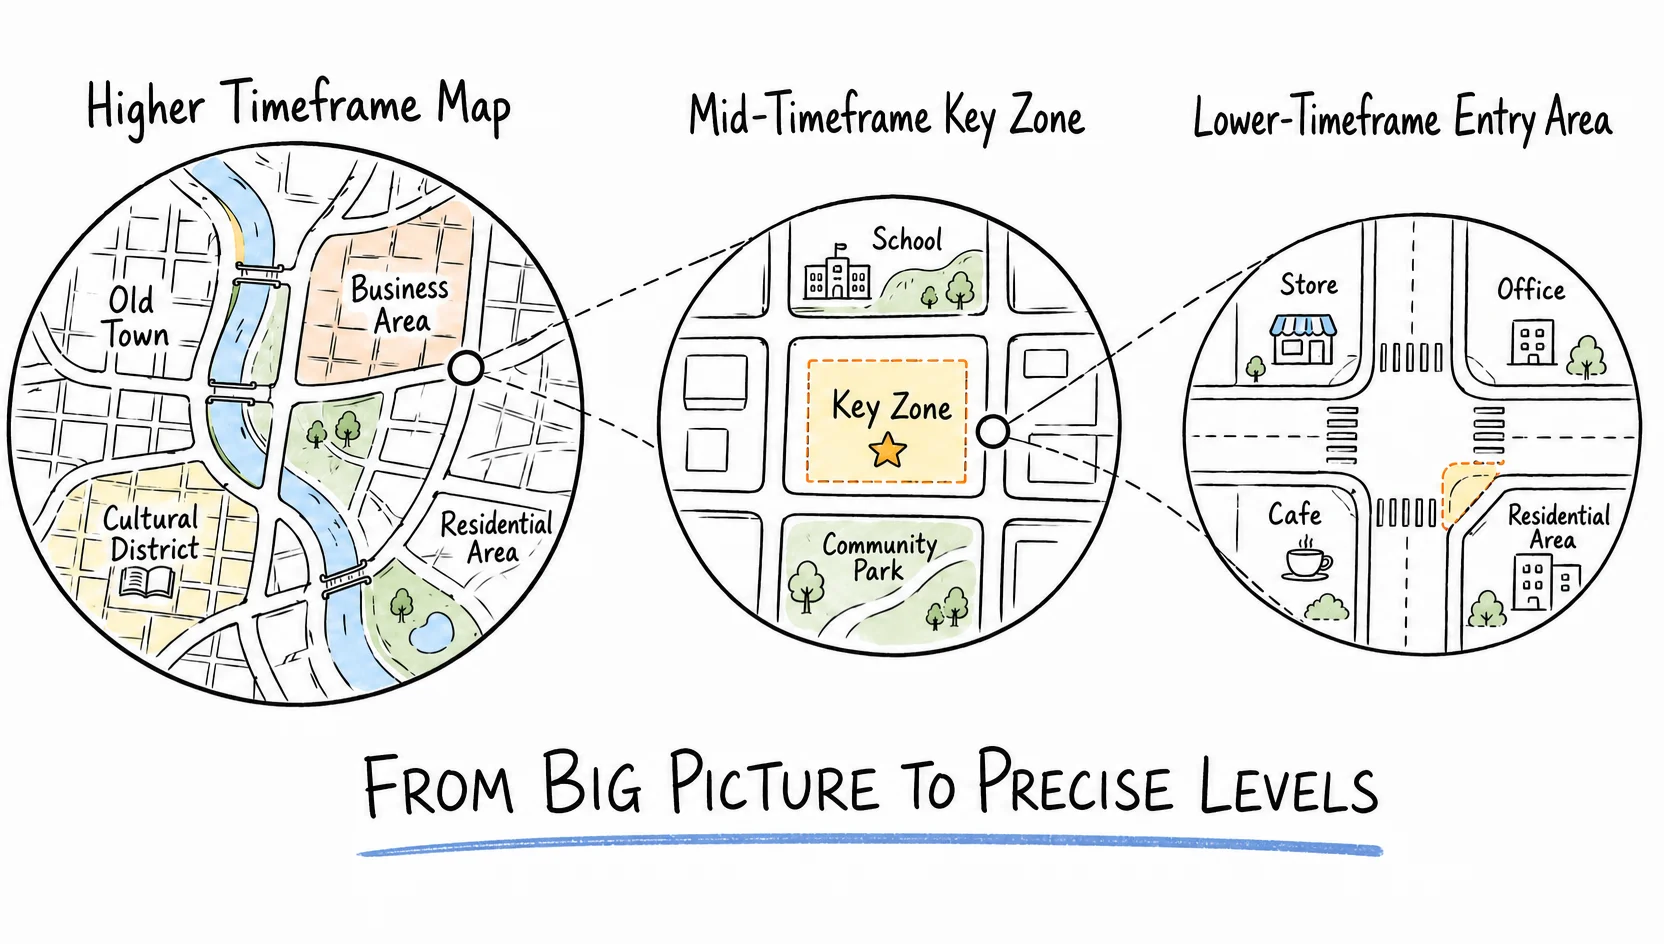
The easiest way to overcomplicate chart reading is to draw levels from the smallest timeframe first.
A better process is top-down: start broad, then narrow.
Step 1: begin with the higher timeframe
Open the daily or 4-hour chart first. Look for the major boundaries that define the recent operating range.
Higher-timeframe levels usually matter more than noisy intraday lines.
Step 2: mark obvious swing points
Focus on the highs and lows where price clearly paused, rejected, or reversed. If you have to argue with yourself to justify a level, it is probably too weak.
Step 3: note repeated reactions
A level that price has respected more than once deserves more attention than a one-off pause. Repetition does not guarantee a hold, but it increases significance.
Step 4: keep round numbers in mind
Large round numbers often attract attention even before price gets there. They are not enough by themselves, but they can strengthen the case for an area.
Step 5: refine, do not overload
After higher-timeframe marking, drop to a lower timeframe only to refine the zone. The goal is clarity, not decoration.
A useful question is: “If I deleted half these lines, would the chart become easier to read?” If yes, delete them.
The biggest mistakes to avoid
Key levels lose value when they turn into clutter or urgency.
Watch for three common mistakes:
- drawing so many levels that none of them stay meaningful
- using a time frame so small that noise feels like structure
- treating a level as a reason to rush instead of a reason to observe
The boundary is simple:
a key level helps you organize attention; it does not tell you what to do next.
How this fits the reading process
If a level is useful, it should help with four things:
- where price is located relative to a meaningful boundary
- what kind of reaction is happening there
- what would make the reading less useful
- which higher-level structure still matters after the reaction
If a level does not help you answer those questions, it is probably too small, too crowded, or too early to use.
Four common mistakes
Key levels become less useful when the chart turns into a wall of lines.
Watch for four common mistakes:
- Too many levels: if every minor pause becomes a level, no level can guide observation.
- Too small a context: a low-timeframe line may look important until the higher-timeframe structure shows it is only noise.
- Too much urgency: price approaching a level is only a reason to observe more carefully, not a reason to rush into a conclusion.
- Too much precision: a key level is usually better treated as an area than as a single perfect price.
The purpose of a key level is to organize attention.
It helps you ask better questions:
- Is price approaching a meaningful boundary?
- Has price reacted there before?
- Is the current reaction clean, weak, or noisy?
- What would make this level less useful as a reading reference?
It should not become a fixed entry line, stop line, target line, or promise that price must react.
Good companion pages
Educational content only. Not financial advice.