Harmonic Patterns Observation Language
Learn harmonic patterns as ratio-based structure labels, including AB=CD, Gartley, Bat, Butterfly, Crab, Shark, Cypher, and 5-0.
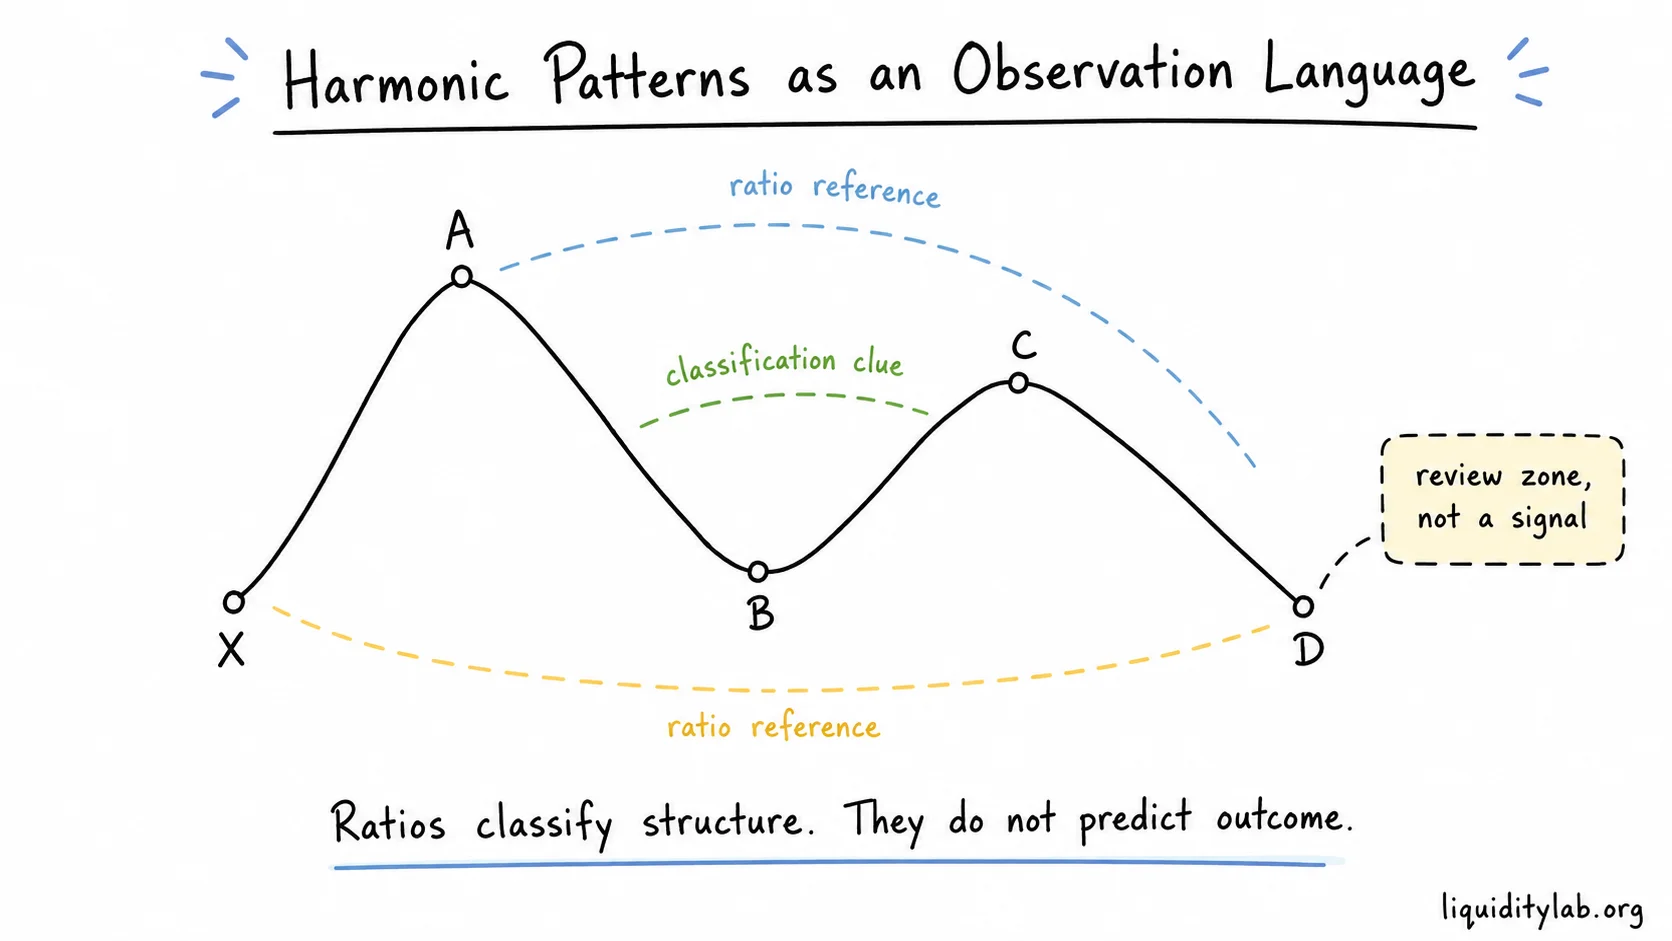
Harmonic patterns are a ratio-based way to classify certain price structures.
In LiquidityLab, harmonic patterns belong to the Framework Mapping layer. They can help describe geometry and proportion in a price path, but they do not provide buy direction, sell direction, entries, exits, stop placement, profit targets, position sizing, leverage, or return expectations.
The core boundary
Harmonic pattern language is built around Fibonacci ratios.
That makes it tempting to treat the ratio as a decision.
LiquidityLab does not use it that way.
The safer interpretation is:
A ratio can help classify a structure. It does not prove what price will do next.
If a pattern looks clean only after the chart is complete, that is a warning sign. Harmonic labels are especially vulnerable to hindsight fitting.
What harmonic patterns are trying to classify
Most harmonic patterns describe a sequence of swings.
The common notation is:
X -> A -> B -> C -> DEach point marks a swing high or swing low. The pattern name depends on how the legs relate to each other by proportion.
For example, a pattern may compare:
- how far B retraces XA
- how far C retraces AB
- how far D extends or retraces a prior leg
- whether AB and CD have similar length
These comparisons create a classification language. They do not create certainty.
AB=CD
AB=CD is one of the simplest harmonic ideas.
It compares two legs:
A -> B
C -> D
The basic idea is that the CD leg may have a similar magnitude to the AB leg.
In safe observation language, AB=CD is a way to say:
this structure contains two comparable movements.
It is not a statement that price must stop, reverse, or reach a target.
Five-point harmonic patterns
Many harmonic patterns use five labeled points:
X-A-B-C-DCommon names include:
- Gartley
- Bat
- Butterfly
- Crab
- Shark
- Cypher
- 5-0
Different sources may define these patterns with slightly different ratio ranges. That disagreement matters.
If the same price path can be forced into several labels by adjusting the start point or swing selection, the label is less useful as evidence.
Pattern labels are not signals
A harmonic pattern label tells you how a structure is being categorized inside that framework.
It does not answer:
- whether price should reverse
- whether price should continue
- where to enter
- where to exit
- where to place a stop
- where a target should be
Those questions belong to trade execution and financial decision-making. This page does not provide that.
Potential Reversal Zone as a review zone
Harmonic materials often use the phrase Potential Reversal Zone, or PRZ.
The risky interpretation is:
price reached the PRZ, so it should reverse.
LiquidityLab uses a safer translation:
a PRZ is a framework-defined review area where an observer can watch whether price behavior changes.
That means the focus stays on behavior:
- Does movement slow?
- Does price reject the area?
- Does price pass through without reaction?
- Does the structure become noisy or unclear?
- Is the pattern label still useful after new price action appears?
The zone is a place to observe, not a command to act.
Why harmonic patterns can mislead beginners
Harmonic patterns can look precise because the ratios are numerical.
But numerical labels do not remove subjectivity.
Several choices still depend on the observer:
- which swing is X
- which high or low counts as A, B, C, or D
- whether a wick or body should define the point
- how much ratio tolerance is acceptable
- whether a messy structure should be labeled at all
The more a pattern requires adjustment after the fact, the less useful it becomes as real-time structure language.
Safer observation questions
If you are reviewing a harmonic-looking structure, ask:
- Is the structure clear before I apply the label?
- Are the swing points obvious, or am I choosing them to make the ratio work?
- Does the pattern sit near a meaningful structural area?
- What would make this label invalid?
- Is the current market state trend, pullback, range, or transition?
- Am I using the ratio to describe structure, or to predict outcome?
These questions keep the pattern inside observation.
Mapping back to Market Structure OS
Harmonic patterns should sit underneath the broader structure reading:
- Market state comes first.
- Visible structure comes first.
- Liquidity and location come first.
- Harmonic labels come later as a possible framework translation.
If the market state is unclear, a harmonic label does not make it clear.
If the structure is messy, a ratio does not make it clean.
Summary
Harmonic patterns are useful as a geometric and ratio-based classification language.
They are not trading signals. They do not predict reversals. They do not define entries, stops, targets, or expected returns.
Use them to describe structure, not to force decisions.