Fair Value Gap (FVG)
What a fair value gap is, how bullish and bearish FVGs form, how they differ from order blocks, and a simple drill to study them. Education only.
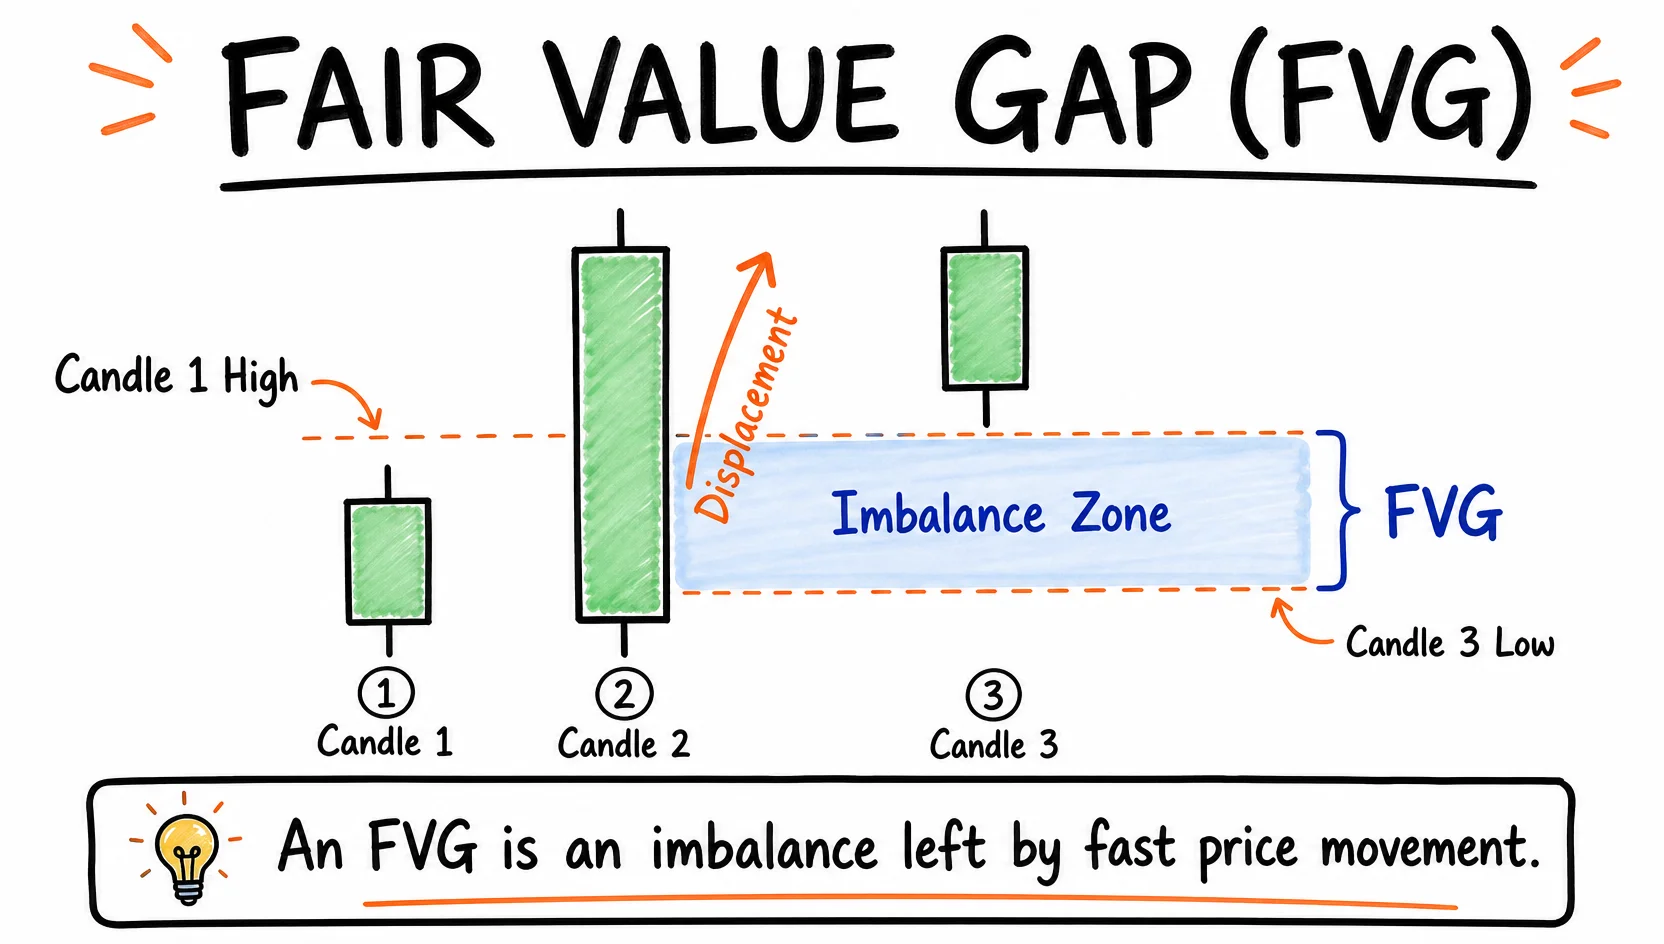
A fair value gap (FVG) is a three-candle price pattern where a fast move leaves an area that was traded only briefly, or barely at all. In ICT and Smart Money Concepts (SMC) study, it describes where price moved too quickly. It is a way to describe the chart, not a signal.
This guide explains how FVGs form, how to mark bullish and bearish gaps, why market structure comes first, how an FVG differs from an imbalance or an order block, and a review drill for historical charts.
New to structure? Start with Market Structure Basics: Learn BOS and MSS first. FVGs are easier to read once you can mark swings cleanly.
One-sentence definition
A fair value gap is the price range between candle 1 and candle 3 that candle 2's fast move left without overlap. Think of it as a section of the chart that price skipped through instead of trading back and forth.
How an FVG forms
Price usually rotates and trades through the same prices repeatedly. Sometimes one side becomes urgent, such as after a stop run, news release, or large order. Price then moves in one direction so quickly that the middle of the move barely trades. This is why FVGs usually appear inside displacement, a strong directional sequence, rather than slow overlapping price action.
The useful question is not whether price must return. Ask whether price returns, how it responds, and what that response says about the surrounding structure.
Bullish and bearish FVGs
Bullish FVG
- Look at three consecutive candles.
- The high of candle 1 is below the low of candle 3.
- The gap between those prices is the bullish FVG; candle 2 is usually a large up candle.
Bearish FVG
- The low of candle 1 is above the high of candle 3.
- The gap between those prices is the bearish FVG; candle 2 is usually a large down candle.
Mark the zone from candle 1's wick to candle 3's wick. The midpoint, often called consequent encroachment, is an extra reference line, not a trigger.
Structure first: context decides whether an FVG matters
Most charts contain many small gaps. Before marking one, ask:
- Where is price in the range? Mark a clear swing range and its 50% level. Lower half is discount; upper half is premium. These describe position, not value or a guaranteed reaction. See Trading Range Structure.
- Did the gap change structure? Displacement that breaks a swing high or low (BOS or MSS) tells you more than a gap in the middle of a range.
- Was liquidity taken first? A gap after a liquidity sweep is a common study sequence: sweep, displacement, then FVG. See Liquidity Pool.
Check one higher timeframe too. A five-minute gap against a clear four-hour structure is a different observation from one that agrees with it.
FVG vs imbalance vs order block
| Term | What it describes | Key question |
|---|---|---|
| Imbalance | The broad idea that one side dominated and price moved inefficiently | Was this move one-sided? |
| Fair value gap | A specific three-candle gap with no wick overlap between candles 1 and 3 | Where exactly did price skip? |
| Order block | The last opposite-coloured candle before a displacement move | Where did the move start? |
An FVG describes inefficiency inside the move. An order block describes the origin of the move. They can appear together, but overlap is only an observation to record. A breaker block is an order block that failed and was broken through, so its role flips; see the glossary.
Common mistakes
“An FVG always gets filled.” Some gaps are revisited quickly, some much later, and some never. Filling is a review question, not a rule.
Treating an FVG as a standalone entry signal. A gap tells you where price moved fast. It does not tell you direction, timing, or risk.
Marking every gap on every timeframe. Limit yourself to gaps created by clear displacement on the timeframe you study.
Ignoring the return. Price may pause, react, slice through, or close beyond the zone. Record each outcome.
Confusing discount with cheap. A gap in discount is not automatically a buying area; location needs context.
Explaining everything as institutional intent. A chart shows where price went and how fast. It cannot prove what an institution was thinking.
Study and review drill
Use this on historical data, not live decisions:
- Choose one market and timeframe; mark obvious swing highs and lows.
- Find three displacement moves that broke structure and mark only their FVGs.
- Before scrolling forward, write: “If price returns here, I want to observe ___, and this reading would be wrong if ___.”
- Record the outcome: no return, pause, reaction, full fill, or close through.
- Tag premium/discount, whether a sweep came first, and higher-timeframe alignment.
- Review weekly. Compare context tags with outcomes and remove notes that added no information.
This observe, write, review loop is the core of LiquidityLab's method. The AI Structure Workbench manual shows how to turn it into a Plan Card.
FAQ
What does FVG stand for? Fair Value Gap. Some traders use imbalance or inefficiency more broadly.
Is an FVG the same as a normal price gap? No. A classic gap is between one candle's close and the next open. An FVG is defined by candles 1 and 3 around one fast middle candle and can form during continuous trading.
Which timeframe is best? None is universally best. Study the timeframe you use and check one higher timeframe for context.
Should price fill an FVG? Not necessarily. Treat the return and response as questions for your review log.
What is consequent encroachment? The 50% midpoint of an FVG, used by some ICT learners as a reference line.
Keep learning
- Next concept: Order Block Basics
- Foundation: Market Structure Basics: BOS and MSS
- Related: Liquidity Sweep
- Related: Premium and Discount in ICT
- Full roadmap: The free ICT / SMC learning path
Want the full system? LiquidityLab Pro unlocks member lessons, case studies, trading plan and review frameworks, and the AI study assistant.
Disclaimer: This page is for educational purposes only. It is not financial advice, a trading signal, or a recommendation to buy or sell any instrument. Fair value gaps describe historical price behavior and do not predict future prices or guarantee any result. Trading involves substantial risk of loss.