Elliott Wave Corrective Structures
Learn Elliott Wave corrective structures as textbook classifications for zigzags, flats, triangles, and complex corrections.
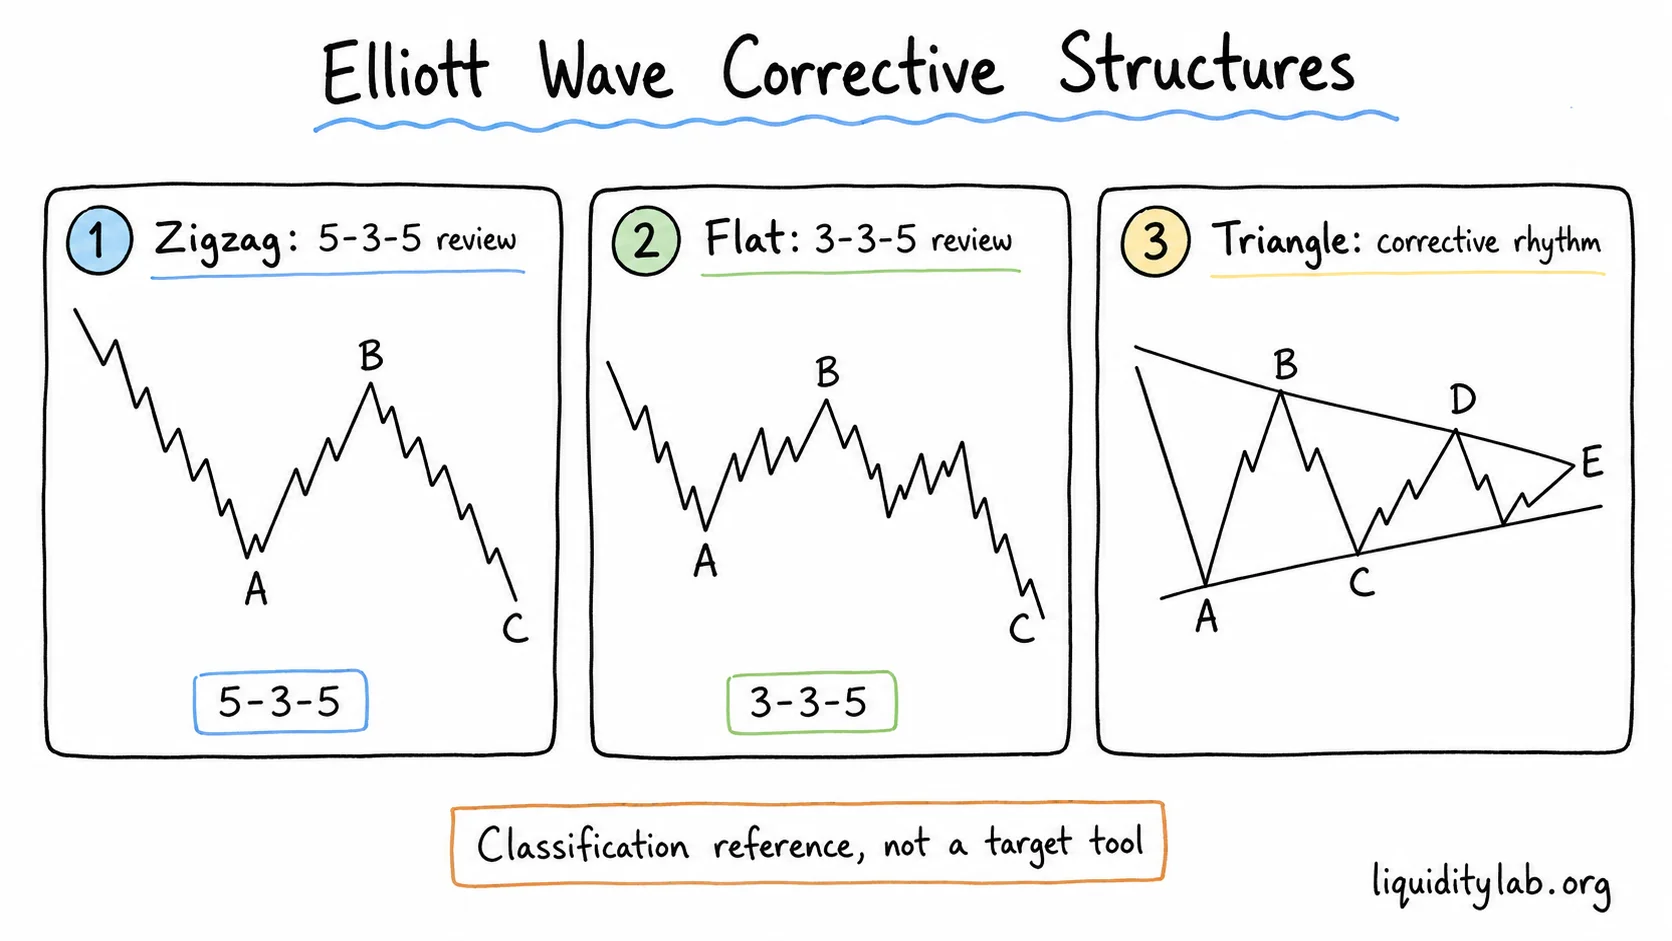
Elliott Wave corrective structures describe movements that are classified as corrections inside the Elliott Wave teaching model.
In LiquidityLab, these structures belong to the Framework Mapping layer. They can help name a possible structure, but they do not provide buy direction, sell direction, entries, exits, stop placement, targets, position sizing, leverage, or return expectations.
Corrections are classification models
Corrective structures are often harder to classify than driving structures.
The reason is simple: corrective movement is usually less clean, more overlapping, and more open to alternative counts.
The safest interpretation is:
a corrective label is a review hypothesis, not proof of what price must do next.
If a price path does not fit a textbook correction, that is normal. The market does not need to match a model.
Zigzag
A zigzag is commonly described as a sharper corrective structure.
Its textbook internal rhythm is often written as:
5 - 3 - 5That means:
- wave A is often counted as five waves
- wave B is often counted as three waves
- wave C is often counted as five waves
In safe observation language, a zigzag label says:
this correction appears to have a sharper directional shape.
It does not mean the C wave must reach a target, extend to a ratio, or complete at a specific level.
Flat
A flat correction is commonly described as a more sideways corrective structure.
Its textbook internal rhythm is often written as:
3 - 3 - 5The key difference from a zigzag is that wave A is usually counted as three waves rather than five.
Textbook material often names several flat variations, such as regular flat, expanded flat, running flat, or contracting flat.
The useful observation is not the label itself. The useful observation is that price may be moving through a corrective structure with overlapping behavior and alternative valid counts.
Triangle
In Elliott Wave, a triangle correction is commonly labeled:
A - B - C - D - EEach segment is often described as a three-wave movement.
Triangles are usually discussed as structures that appear before a later resolution, often in wave 4, wave B, or near the end of a combined correction.
The risk is obvious:
a triangle label can easily become a breakout prediction.
LiquidityLab does not use it that way.
A triangle label is only a way to describe contraction, overlap, and a possible five-part corrective rhythm.
Complex corrections
When a correction cannot be described cleanly as one simple zigzag, flat, or triangle, Elliott Wave material may use complex correction labels.
Common notation includes:
W - X - Yor, in more complex examples:
W - X - Y - X - ZThese labels can describe combinations of simpler corrective structures.
They can also become a way to keep forcing a wave count after the chart has become unclear.
Use complex corrections carefully. If the label makes the chart harder to understand, it may not be helping.
Ratios are educational references
Elliott Wave materials often mention Fibonacci ratios.
For example, a textbook may compare the length of wave C to wave A, or compare one corrective segment to another.
In LiquidityLab, these ratios are educational references.
They are not:
- price targets
- required endpoints
- profit objectives
- evidence that a correction must finish
- reasons to enter or exit
If the ratio becomes the main reason for a conclusion, the analysis has moved away from structure observation.
Orthodox top and bottom
Some Elliott Wave material distinguishes between the price extreme and the orthodox end of a wave pattern.
The orthodox top or bottom refers to where the wave structure is considered complete inside the model, not necessarily the highest high or lowest low on the chart.
This idea can be useful when reviewing a count.
It should not be used to ignore visible structure. If the concept makes the reading less clear, return to the basic price path first.
Corrective labels versus ordinary price action
Many corrective structures overlap with ordinary price-action concepts.
For example:
| Ordinary chart language | Possible Elliott Wave translation |
|---|---|
| Wedge-like structure | Diagonal or corrective triangle, depending on location and count |
| Flag-like pullback | Zigzag, flat, or triangle candidate |
| Trading range | Flat, triangle, or complex correction candidate |
| Failed head-and-shoulders look | Possible expanded-flat style interpretation |
These are translations, not exact equivalents.
Two frameworks can describe the same price path with different vocabulary.
Mapping back to Market Structure OS
Before using corrective labels, ask:
- What is the current market state?
- Is price trending, pulling back, ranging, or transitioning?
- Are highs and lows becoming clearer or more overlapping?
- What evidence supports the corrective label?
- What would invalidate the label?
If the answer is unclear, the label should stay provisional.
Summary
Elliott Wave corrective structures are textbook classification models.
Zigzags, flats, triangles, and complex corrections can help describe overlapping or counter-move behavior. They should not be used as price targets, reversal predictions, or trading instructions.