Trading System Building
Learn how to think about trading system building as a repeatable observation and review process, not a collection of signals or live trade instructions.
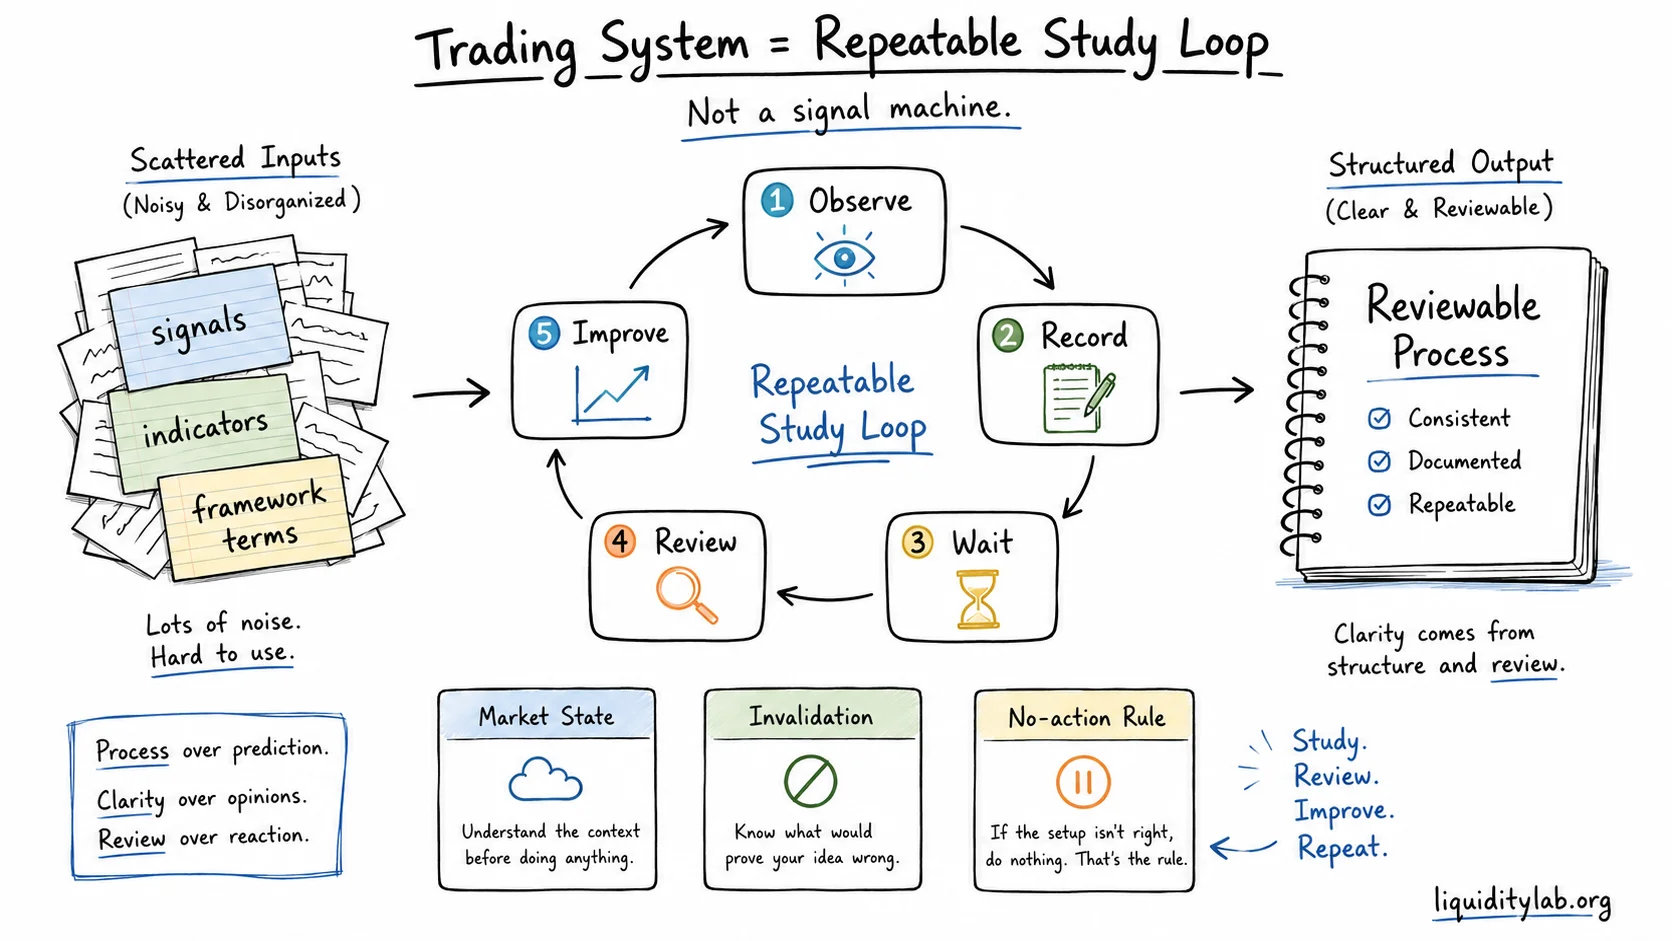
A trading system is often misunderstood as a list of signals.
In LiquidityLab, that is not the starting point.
A system is a repeatable process for observing, recording, waiting, reviewing, and improving.
This page explains system building as a study framework. It is meant to help you make your observations more consistent and reviewable.
Educational content only. This page does not provide trade direction, entries, exits, stop-loss levels, targets, position sizing, leverage, or return expectations.
Why more signals do not solve the problem
Many learners collect tools:
- indicators
- candlestick patterns
- chart patterns
- SMC / ICT terms
- Wyckoff language
- Elliott Wave counts
- harmonic ratios
The problem is not that these tools are useless.
The problem is that tools do not automatically create order.
Without a system, every chart becomes a new negotiation:
- Which signal should I trust?
- Which timeframe matters?
- Is this a real setup or only a reaction?
- Should I keep waiting or change my view?
- Was the mistake technical, emotional, or procedural?
A system reduces that chaos by giving every observation a place.
A system is a process, not a promise
A useful study system does not promise that one reading will be right.
It gives you a way to repeat the same process often enough that you can review it.
Think of it like a flight checklist.
The checklist does not control the weather. It helps the pilot avoid skipping important steps under pressure.
For market study, a system works the same way:
- it gives you a starting point
- it defines what to observe first
- it separates evidence from interpretation
- it names conditions that would weaken the reading
- it creates records that can be reviewed later
The goal is not certainty.
The goal is repeatability.
When a system discussion starts to involve entries, exits, stops, targets, order management, or position sizing, move it out of public system-building language and into simulated training. LiquidityLab handles that boundary in Execution Training and Plan Layer.
The five parts of a study system
For educational use, a trading study system can be described with five parts.
1. Observation condition
What makes the chart worth studying?
This is not an entry condition.
It is the first filter that tells you, "There may be something here to observe."
Examples of observation conditions:
- price is near a clear range boundary
- price is testing a previous high or low
- a trend appears to be pulling back
- a range is forming after a strong move
- a structure break is being retested
The question is:
What visible structure makes this chart worth recording?
2. Risk boundary
In LiquidityLab language, a risk boundary is not a stop-loss instruction.
It is the condition that tells you the current reading is no longer useful.
Examples:
- the supposed range no longer holds
- price accepts back inside the prior structure
- the expected pullback becomes a deeper structural change
- the "breakout" immediately fails and returns to the range
- the chart remains noisy enough that no clear observation can be made
The question is:
What would make this interpretation weaker?
3. Reference area
Many systems talk about targets.
For study, it is safer to use reference areas.
A reference area is a place where you expect the chart to reveal information, not a promised destination.
Examples:
- previous high
- previous low
- range boundary
- untested reaction zone
- structure level from a higher timeframe
The question is:
Where might price give more information?
4. Participation boundary
Participation is often discussed as position sizing, risk percentage, or leverage.
This page does not provide those instructions.
For study, the safer question is behavioral:
Under what conditions should I stay in observation mode instead of acting?
Examples:
- the market state is unclear
- the chart is between important areas
- the structure changed too quickly to record
- the observation depends on emotion or urgency
- you cannot write the invalidation condition clearly
A good system does not only tell you when to pay attention.
It also tells you when to stop forcing a judgment.
5. Review loop
The review loop is what turns a system from an idea into training.
Review asks:
- What did I originally record?
- What did price actually do?
- What structure did I misunderstand?
- Was the mistake in observation, process, or emotion?
- What should I write more clearly next time?
Without review, a system becomes a belief.
With review, it becomes a learning loop.
Before using any framework, set the observation order
Before applying SMC, Wyckoff, Elliott Wave, harmonic patterns, Chan Theory, or any other framework, start with neutral structure.
Use this order:
Structure -> Liquidity / zones -> Location -> Scenario -> ReviewDo not start with the framework label.
Start with what price is visibly doing.
Then, if useful, translate that structure into a framework language.
This keeps the system from becoming a vocabulary contest.
Three time windows
A system is easier to review when you separate three time windows.
Before the chart session
Decide what you are here to practice.
Examples:
- only mark market state
- only identify range boundaries
- only write one invalidation condition
- only compare your observation with AI after writing your own record
This window is about preparation, not prediction.
During observation
Follow the same record format.
For LiquidityLab, that usually means:
Structure:
Liquidity:
Location:
Then add:
This reading becomes weaker if...If you cannot write the record, the system has already given you information: the chart is not clear enough yet.
After the chart develops
Review the original record.
Do not rewrite history.
Ask what was visible at the time.
The key question is:
Was the original observation clear enough to review?
Process goals are safer than outcome goals
Outcome goals are tempting:
- "I want to be profitable this week."
- "I want to catch the next move."
- "I want to stop missing opportunities."
For study, these are hard to control and easy to distort.
Process goals are more useful:
- write one three-line observation per day
- review three old records this week
- mark invalidation before asking AI
- avoid changing the record after seeing the result
- collect ten examples of unclear market state
The process goal is not glamorous.
It is measurable.
That is why it can be improved.
A simple scenario framework
Once you have a record, you can describe the chart using three broad scenarios:
Scenario A: favorable observation
The market state is clear enough to study.
The structure, location, and reference areas are visible.
You can write what would weaken the reading.
This does not mean "take a trade."
It means the observation is clear enough to save and review.
Scenario B: warning observation
The structure exists, but the evidence is getting weaker.
Examples:
- repeated tests without progress
- a pullback becoming too deep
- a range becoming noisy
- the chart reacting strongly in both directions
This is a prompt to slow down.
Scenario C: no-action observation
The chart is too unclear to force a reading.
Examples:
- price is in the middle of a range
- no boundary is close
- the structure is transitional
- the observation depends mostly on a guess
No-action is not failure.
It is part of the system.
Keep the system small at first
Early system building often fails because the learner tries to include everything.
A better starting point:
- one market state model
- one structure record format
- one invalidation habit
- one review template
- one weekly improvement question
You can add complexity later.
First, make the simple loop repeatable.
Use this with the AI Workbench
The AI Workbench can help organize your process, but it should not replace your first observation.
Recommended workflow:
- Write your own three-line observation.
- Ask Structure Engine to organize the market state.
- Ask Simulation Engine to list long-side, short-side, and wait observation scenarios.
- Ask Framework Mapping only after the neutral structure is clear.
- Generate a Plan Card as an observation record, not a trade plan.
- Review the record later with the four-step review.
Useful pages:
- LiquidityLab Market Structure OS
- AI Structure Workbench Beginner Manual
- Execution Training and Plan Layer
- Trading Review Method
- Independent Thinking and Judgment Boundary
- Cognitive Biases and Trading Psychology Barriers
Weekly system-building practice
For one week, practice only this:
- Pick one chart.
- Write Structure, Liquidity, and Location.
- Write one invalidation condition.
- Mark the market state as Trend, Pullback, Range, Transition, or Unclear.
- Save the record.
- Review it later without editing the original.
At the end of the week, ask:
- Which part was easiest to write?
- Which part was consistently vague?
- Did I confuse a framework label with structure?
- Did emotion make one scenario feel more certain than it was?
- What one sentence should I write more clearly next week?
This is the foundation of system building.
Not a better signal.
A better loop.
Educational content only. Not financial advice.