Four Layers of Trading Thinking
Learn how to separate trading principles, methods, techniques, and tools so your study process becomes less scattered.
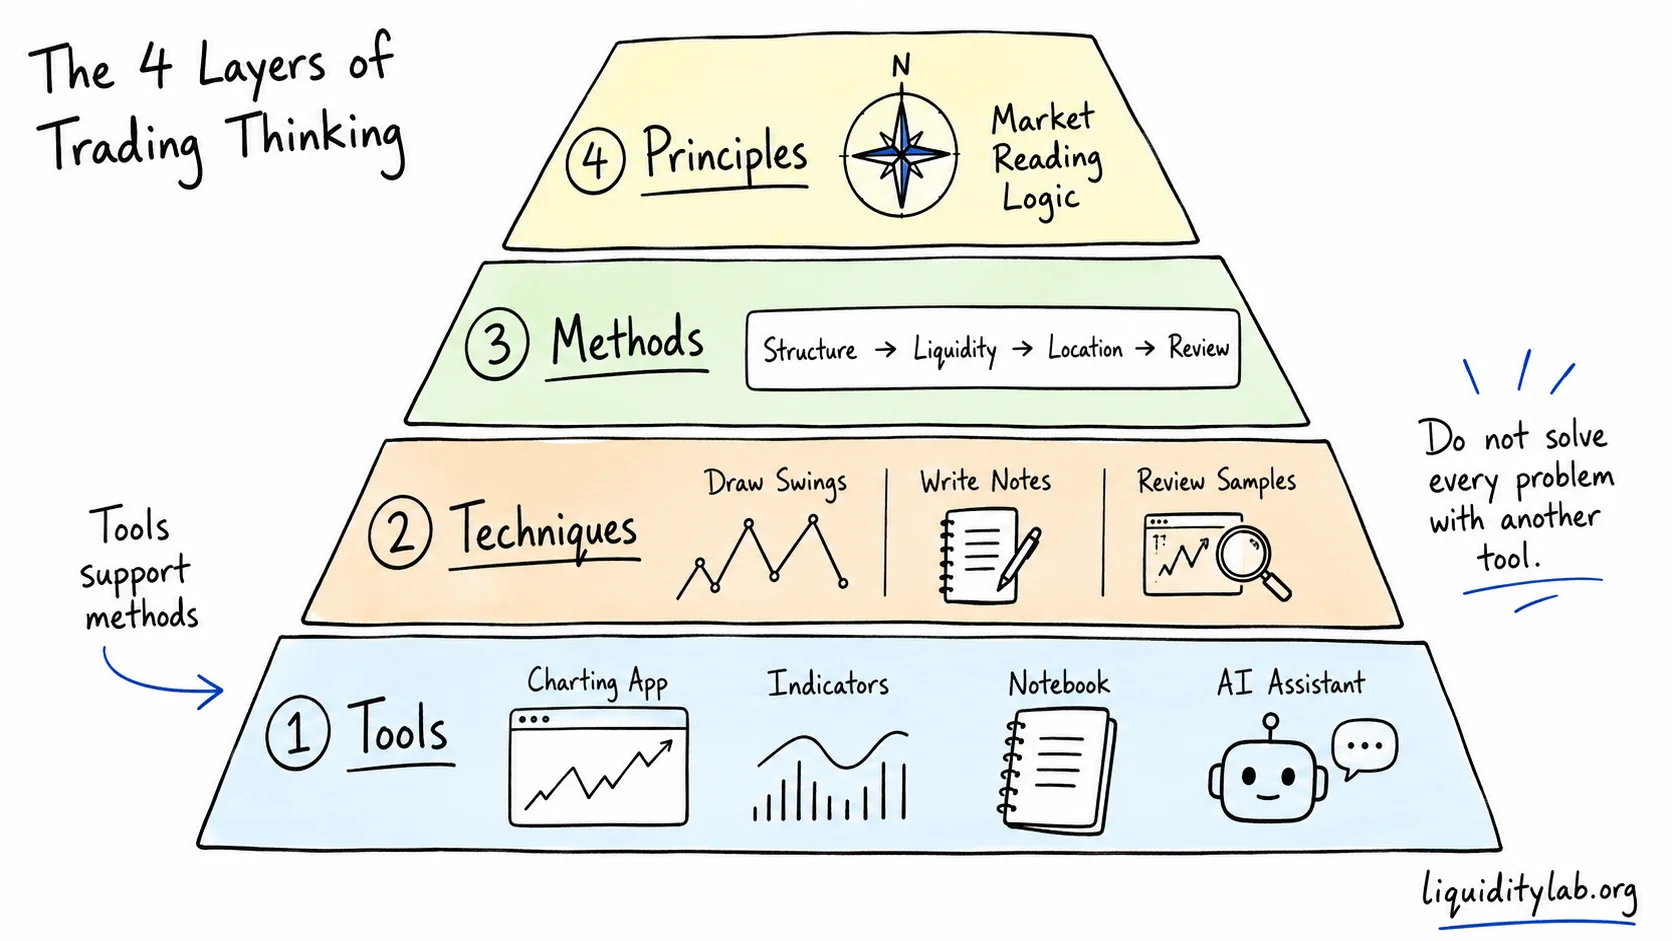
Many trading learners begin in the same place.
They open a charting platform, see candles, moving averages, MACD, Bollinger Bands, drawing tools, alerts, indicators, and endless settings.
Learning those tools is not wrong.
But if your whole study process stays at the tool level, the chart can become more crowded while your judgment becomes less clear.
This playbook introduces a simple four-layer thinking model:
Principles -> Methods -> Techniques -> ToolsIt is adapted from the Chinese learning phrase "Dao-Fa-Shu-Qi", but this page uses it as a practical study map, not as a ranking system.
Educational content only. This page does not provide trade direction, entries, exits, stop-loss levels, targets, position sizing, leverage, or return expectations.
The four layers
The four layers help you ask: "What level am I actually thinking on?"
1. Principles
Principles are the deepest assumptions behind your market reading.
They include questions such as:
- What kind of market behavior am I trying to understand?
- Do I believe price is mostly random noise, participant behavior, liquidity movement, auction process, or something else?
- What should count as evidence?
- What should remain uncertain?
In LiquidityLab language, this layer is where you define your market-reading worldview.
It does not mean you have a perfect answer.
It means you know what kind of logic you are using.
2. Methods
Methods are the frameworks that translate principles into a repeatable way of looking.
Examples include:
- market structure reading
- trend and pullback classification
- range-boundary observation
- liquidity mapping
- review routines
- framework mapping, such as SMC, Wyckoff, Elliott Wave, or Chan Theory as language layers
Methods help you decide what to observe first, what to ignore, and how to organize notes.
3. Techniques
Techniques are the smaller operational skills inside a method.
They may include:
- drawing a clean swing structure
- separating a pullback from a reversal attempt
- writing a three-sentence observation
- marking where an idea would be invalidated
- reviewing one sample without rewriting the original judgment
Techniques are useful, but they need a method above them.
Otherwise each technique becomes another isolated trick.
4. Tools
Tools are the visible instruments:
- charting platforms
- indicators
- drawing tools
- screeners
- journals
- templates
- AI assistants
Tools matter.
But tools should support the upper layers.
If you do not know your principle, method, or technique, a better tool usually only makes the confusion faster.
A simple driving example
Imagine driving from one city to another.
- The car is the tool.
- Driving skill is the technique.
- Route planning is the method.
- Knowing the destination is the principle.
A faster car helps.
Better driving skill helps.
A good route helps.
But if the destination is wrong, every improvement helps you move faster in the wrong direction.
Trading study often has the same problem.
Learners keep upgrading the car:
- a new indicator
- a new platform
- a new template
- a new model name
- a new expert's vocabulary
But the deeper question is still unclear:
What am I trying to read from the market, and what kind of evidence would make that reading clearer?
Why tool-level learning feels productive
Tool-level learning feels productive because it is visible.
You can add an indicator.
You can change a setting.
You can draw more lines.
You can collect more terminology.
But visible activity is not always learning.
Sometimes the learner is only changing the interface of confusion.
That is why this four-layer model is useful.
It gives you a diagnostic question:
Is this problem about my tool,
my technique,
my method,
or my underlying principle?
Common mismatches
Tool problem disguised as a principle problem
Sometimes the issue really is small:
- the chart is messy
- the timeframe is inconsistent
- the notes are not saved
- the drawing template is hard to read
In that case, improving the tool helps.
But do not turn every small tool issue into a deep philosophy problem.
Technique problem disguised as a tool problem
Sometimes the tool is fine, but the user does not have a repeatable technique.
For example, a learner may use a clean charting platform but still mark swings differently every time.
The solution is not another platform.
The solution is a clearer marking rule and repeated review.
Method problem disguised as a technique problem
Sometimes individual techniques are practiced, but they do not belong to one coherent method.
The learner knows how to mark a channel, a key level, a liquidity area, and a reversal pattern, but does not know which one should come first.
This is a method problem.
The fix is sequencing.
Principle problem disguised as a method problem
Sometimes the learner switches methods every week because the deeper principle is not stable.
One week the market is treated as indicator signals.
Next week it is treated as smart-money manipulation.
Next week it is treated as wave structure.
Each framework may contain useful language.
But without a stable market-reading principle, the learner keeps borrowing other people's conclusions without building their own observation process.
How to use the model in practice
Use the four layers after a confusing study session.
Ask four questions:
Principle:
What was my basic belief about what mattered on this chart?

Method:
What framework or sequence did I use to read it?

Technique:
What specific skill did I apply?

Tool:
What software, indicator, template, or AI feature supported the work?
Then identify the weakest layer.
The answer is not always "study higher-level principles".
Sometimes the next best improvement is very practical:
- simplify the chart
- use one observation template
- review fewer samples more carefully
- stop mixing frameworks for two weeks
- write the original judgment before reading commentary
The goal is not to sound sophisticated.
The goal is to make the next practice loop easier to review.
How this connects to Market Structure OS
LiquidityLab's Market Structure OS is mostly a method layer.
It gives you a neutral sequence:
Structure -> Liquidity -> Location -> Scenario -> ReviewDifferent frameworks can then become translation layers:
- SMC may describe the same structure in liquidity language.
- Wyckoff may describe the same behavior as a phase or test.
- Elliott Wave may describe it as a wave relationship.
- Chan Theory may describe it through segment and center language.
But the frameworks should not replace the base observation.
They should translate it.
That distinction prevents tool-hopping and terminology-hopping from becoming your study process.
A reflection exercise
Choose one recent chart observation or study note.
Do not ask whether it was "right" or "wrong" first.
Instead, classify it:
Principle:

Method:

Technique:

Tool:
Then answer:
- Which layer was clearest?
- Which layer was most unstable?
- Did I try to solve a method problem by adding a tool?
- Did I borrow a framework conclusion before writing my own structure observation?
- What is one layer I can simplify in the next practice session?
The point
The four-layer model is not a magic formula.
It is a sorting tool.
It helps you see whether your confusion comes from the tool you use, the technique you apply, the method you follow, or the principle you have not yet clarified.
Once you know the layer, the next step becomes smaller.
And smaller steps are easier to practice, review, and improve.