Observation Management After a Trade Idea Starts
A study playbook for managing an observation after a trade idea starts: reference areas, adaptive observation, reading boundaries, and review discipline.
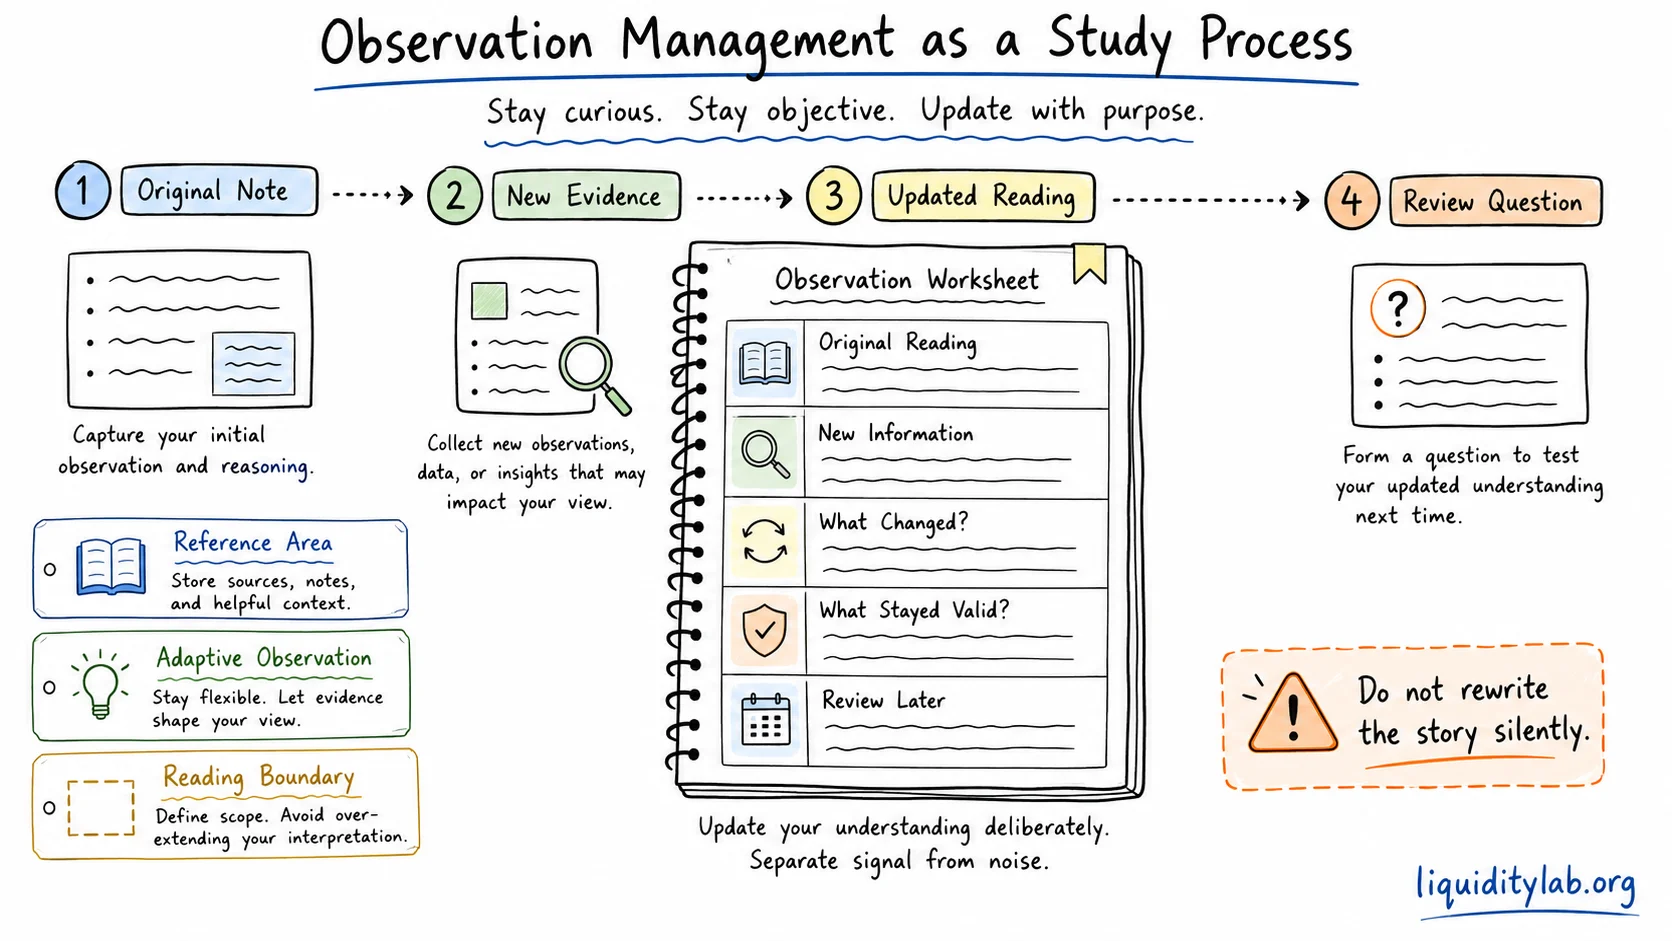
Many learners think the hard part is the first idea.
They ask:
Is this a valid setup?
Is this the right direction?
Where should the plan begin?
But a different problem appears after the idea starts moving.
The chart changes.
The learner's emotion changes.
The original note begins to feel either too cautious or too confident.
This page is about what happens next.
It is not an order-management guide.
It is a study playbook for managing an observation after a trade idea has already started.
Educational content only. This page does not provide trade direction, entries, exits, stop-loss levels, targets, position sizing, leverage, or return expectations.
Why observation management matters
A market idea rarely stays frozen.
After the first observation, new information appears:
- price may continue
- price may return to a prior area
- the market state may shift
- a range may absorb the move
- a pullback may deepen
- a trend idea may become less clear
- the learner may begin to defend the first interpretation
Without a management process, the learner often improvises.
The problem is not only technical.
It is behavioral.
The question becomes:
How do I keep observing without rewriting the story every few minutes?The first boundary: observation, not control
Observation management does not mean controlling the market.
It means keeping the original reading visible as new information arrives.
A useful record separates three layers:
Original reading:
New information:
What changed in the interpretation:
This prevents one common mistake:
the learner quietly changes the original idea, then later reviews the revised version as if it had been clear from the start.
That is not review.
That is story repair.
Predefined reference versus adaptive observation
Many systems use predefined references.
For study, a reference is not a promised destination.
It is a place where the chart may reveal information.
Examples of reference areas:
- previous high
- previous low
- range boundary
- reaction zone
- higher-timeframe structure level
- area where the original reading should become clearer or weaker
The safer question is:
What might this area help me observe?not:
What must price do here?Adaptive observation is different.
It does not begin with a fixed reference.
It asks how new information changes the reading:
- Is the structure still coherent?
- Did the market state change?
- Did the move create clearer evidence or more noise?
- Is the original observation still reviewable?
- Am I adding complexity to defend the first idea?
Both styles can be useful in study.
The danger appears when the learner mixes them without noticing.
Short-horizon versus longer-horizon expectation
The Chinese source discusses short-term and medium-term positioning.
For English readers, the safer learning frame is:
short-horizon expectation
longer-horizon expectation
This is not a holding-period recommendation.
It is a way to describe what kind of movement the original observation expected.
A short-horizon expectation usually assumes:
- the next response matters quickly
- the reading should become clearer soon
- deeper back-and-forth may weaken the idea
- the learner should avoid adding explanations if the first reaction fails
A longer-horizon expectation usually assumes:
- the chart may move through several smaller reactions
- the learner needs a wider review context
- temporary noise should be separated from structural change
- the original note must say what kind of pullback or pause is still compatible with the reading
Neither is better.
The problem is mismatch.
For example, a learner may write a broad, longer-horizon idea but emotionally react to every small candle as if the idea were short-horizon.
Or the learner may write a short-horizon idea but keep extending it after the original condition is gone.
Observation management helps reveal that mismatch.
Initial boundary versus adjusted reading boundary
Risk language is easily misunderstood.
In this page, a boundary is not a stop-loss instruction.
It is the condition under which a reading becomes weaker, unclear, or no longer useful.
An initial reading boundary is written before the observation develops.
It might answer:
What would make this current interpretation less useful?An adjusted reading boundary is written after new information appears.
It might answer:
After this new structure appears, what should I now review?The key is not to adjust the boundary in order to protect the ego.
The key is to update the observation only when the chart gives new evidence.
Write the reason for the adjustment.
Do not simply move the explanation.
The cost of manual interference
Manual interference happens when the learner keeps changing the observation because the chart feels uncomfortable.
This can look like:
- adding a new framework label after the first label fails
- calling every small reaction "confirmation"
- changing the timeframe to rescue the first idea
- moving from structure language into emotion language
- declaring the observation invalid too early because uncertainty feels unpleasant
Sometimes a new note is useful.
But constant intervention can destroy the learning sample.
If the original observation changes five times, what exactly will be reviewed later?
This is the tradeoff:
More intervention may reduce discomfort.
More intervention may also reduce review clarity.
The point is not to avoid all adjustment.
The point is to make every adjustment visible.
A simple observation-management template
Use this after an initial record has already been written.
Original market state:

Original scenario:

Original reading boundary:

New information since the first note:

Does this strengthen, weaken, or complicate the reading?

What changed in my interpretation?

What should remain unchanged?

What will I review later?
This is not a trading plan.
It is a review container.
It prevents the learner from blending the original idea, the updated idea, and the emotional reaction into one confusing story.
What not to do
Avoid using observation management as a hidden execution layer.
Do not turn this page into questions like:
- Where should I exit?
- Where should I move the stop?
- Should I take partial profit?
- How much should I hold?
- Should I add or reduce size?
- What is the best management method?
Those are execution questions.
This page is about study.
The safer questions are:
- What did the original observation say?
- What new information appeared?
- Did the market state change?
- Which boundary became clearer?
- Which assumption was added too late?
- What will make the next record easier to review?
How this connects to the AI Workbench
The AI Structure Workbench is most useful when your notes are visible.
Before asking AI to interpret a changed chart, write:
Original record:
New information:
What I think changed:
What I am unsure about:
Then ask for help in structure language:
Please help me review whether this observation became stronger, weaker, or more uncertain.
Do not give trade direction, entries, exits, stop-loss levels, targets, or position sizing.
This keeps AI in the role of review assistant, not decision-maker.
Reflection exercise
Choose one old chart observation that changed after your first note.
Answer:
1. What was the original reading?
2. What new information appeared?
3. Did I update the reading with evidence or with emotion?
4. Which part of the original note stayed valid?
5. Which part became weaker?
6. Did I make the adjustment visible enough to review later?
7. What should I write more clearly next time?
Do not judge the exercise by whether the final outcome looked good.
Judge it by whether the observation history stayed honest.
The point
The market changes.
Your reading can change too.
But the change should be visible.
Observation management is the discipline of keeping that trail intact:
Original note -> New evidence -> Updated reading -> Review questionThe goal is not perfect control.
The goal is a process that remains reviewable after uncertainty appears.